- How have we looked at the data?
- Introduction from Andy Miles
- Leasing market: data at a glance and key takeaways
- Quarterly spotlights
- Leasing market: sector summaries
- Investment market: data at a glance and key takeaways
- Investment market: sector summaries
How have we looked at the data?
- All data compares 1st July 2024 – 30th September 2024 with the same period a year ago
- Demand definition: all enquiries to commercial agents about listings for lease, or to invest in via Rightmove
- Supply definition: the number of available commercial real estate listings for lease or investment on Rightmove, adjusted to strip out the effect of any growth in our partner base
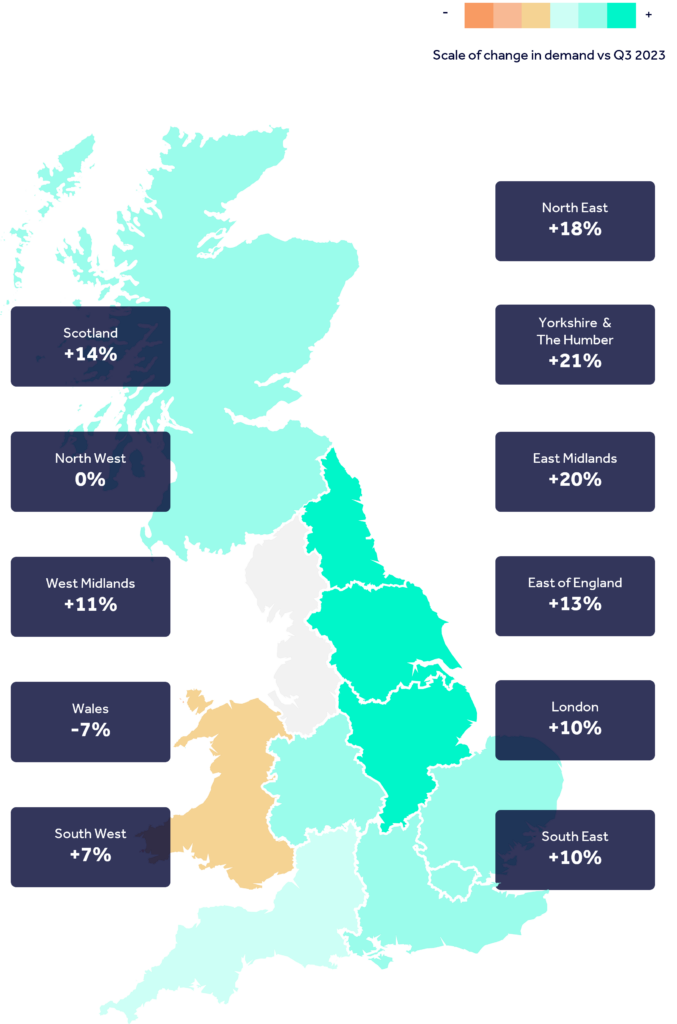
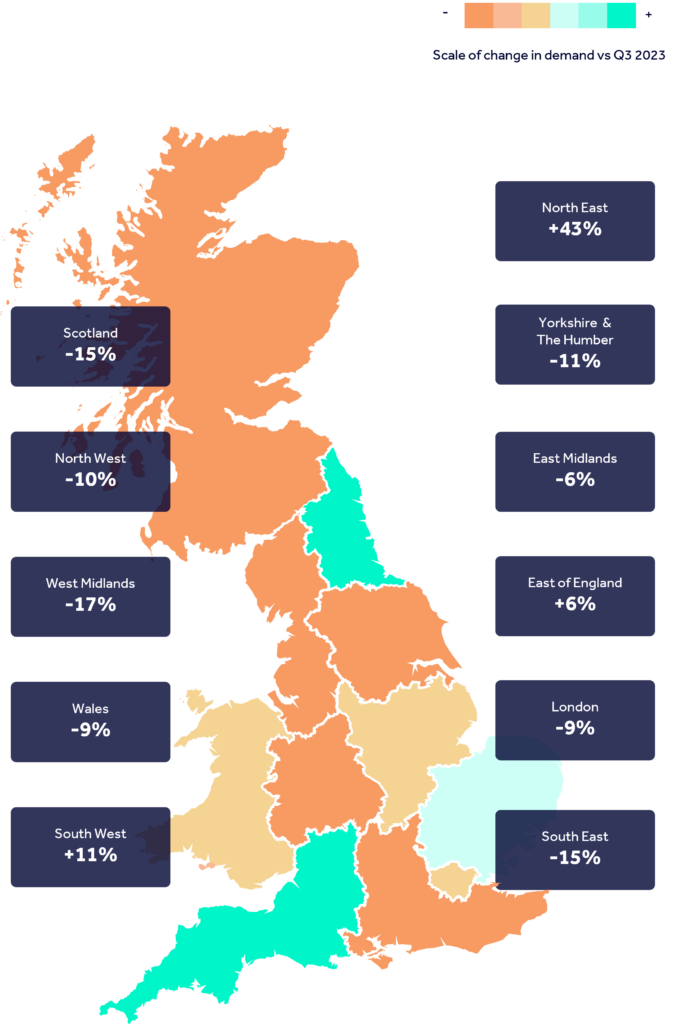
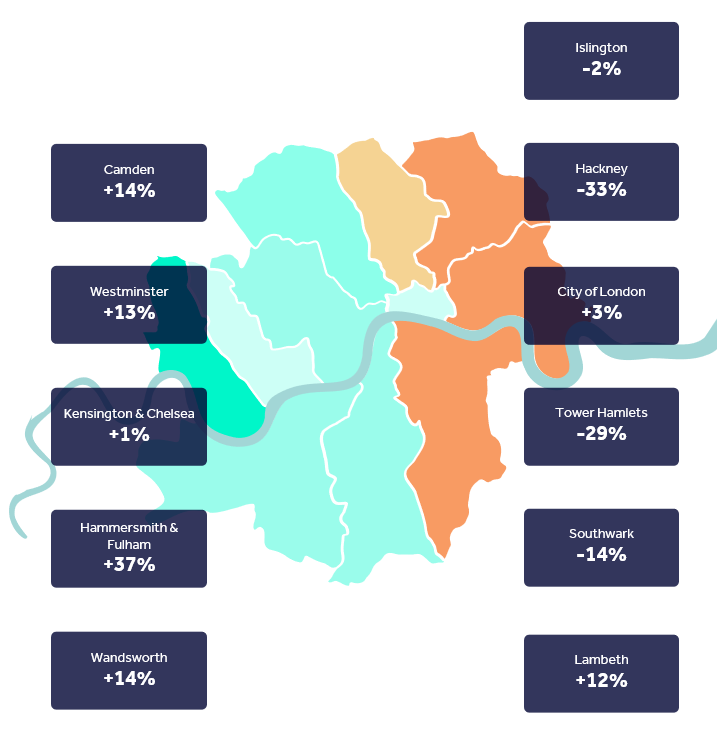
- Colour key: Teal colours represent areas with more growth in demand or available listings than a year ago, while red shaded areas represent less demand or available listings than a year ago
- The heat maps compare retail leasing demand in Q3 2024 with the same period a year ago.
About our report
We acknowledge that some market participants will look at demand and supply differently, for example as an aggregate of active searches by tenant representatives, measured in square feet. We aim to provide an alternative lens that makes the best use of our unique dataset.
Introduction

We’re the UK’s number one commercial real estate destination and our vision is to give everyone the belief that they can make their move.
Commercial real estate on Rightmove is seen by the largest and most engaged audience in the UK, and we’ve analysed millions of data points from this audience to bring you our Commercial Insights Tracker.
These high-level trends help us to see what’s happening in the sectors and sub-sectors of the market.
We hope you find these insights useful to complement your own market data.
Andy Miles, Rightmove’s MD of Commercial Real Estate
Insights from experts
“We’ve seen an overall improvement in demand trends this quarter compared with Q2. The industrial sector now has double digit growth in demand versus last year, while the leisure sector returns to positive growth. Though the office and retail sectors still lag behind last year, the gap has narrowed compared with last quarter.”
“We’ve seen some sharp increases in demand across all sectors in the investment market when compared with the same period a year ago. A likely contributor is falling interest rates, which is of course decreasing the cost of capital and making investing in commercial property more attractive.”
Andy Miles, Rightmove’s MD of Commercial Real Estate
“Although the Bank of England Base Rate is starting to fall, there is an acceptance that rates are not going to return to the record lows experienced from 2009 to 2022. During this 13-year period, investors became accustomed to borrowing very cheap money. Times have changed and there is now greater uncertainty. Therefore, some investors are potentially diversifying away from residential investment and looking for higher yields, and commercial property generally offers this. Coupled with strong availability of bank funding, the commercial market is becoming increasingly attractive.”
John Mitchell, Managing Director at Christie Finance
“This year, we have seen a return to a steady and robust occupier market, with take up of industrial space on a par with levels recorded in pre-pandemic years. With inflation now below the Bank of England’s 2% target and above inflation wage growth, the economic outlook and consumer confidence are improving. Consumers starting to loosen the purse strings and spending more on discretionary goods, in turn, driving demand for more delivery services. As a result, businesses are feeling more confident in pushing forward with expansion or relocation plans, in turn, boosting demand for industrial and logistics facilities.
“It’s a really interesting time for the industrial and logistics sector. Managing supply chains is becoming more complex, with a heightened emphasis on sustainability across global networks. Businesses now face growing reporting requirements and an increasing demand for supply chain transparency. Geopolitical threats and tensions are also reshaping international supply chains. Given the sector’s close ties to transportation and global networks, it stands at the forefront of these changes.
“As a result of these growing complexities, businesses are increasingly turning to specialist third party logistics firms (3PLs) to manage more of their supply chain infrastructure. These specialized firms leverage cutting-edge technologies—such as artificial intelligence (AI), big data analytics, and blockchain—to optimize supply chain ecosystems and offer end-to-end visibility and enhanced decision-making. As these technologies become more widely adopted and logistics services are increasingly outsourced, we will see demand progressively focus on well-located, modern facilities.
“We expect both leasing and investment activity to further strengthen. We are in the early stages of an interest rate cutting cycle, and as debt financing costs reduce, we will see greater levels of activity from developers, operators and investors.”
Claire Williams, Head of UK & European Industrial Research at Knight Frank
Leasing market: data at a glance and key takeaways
Data at a glance
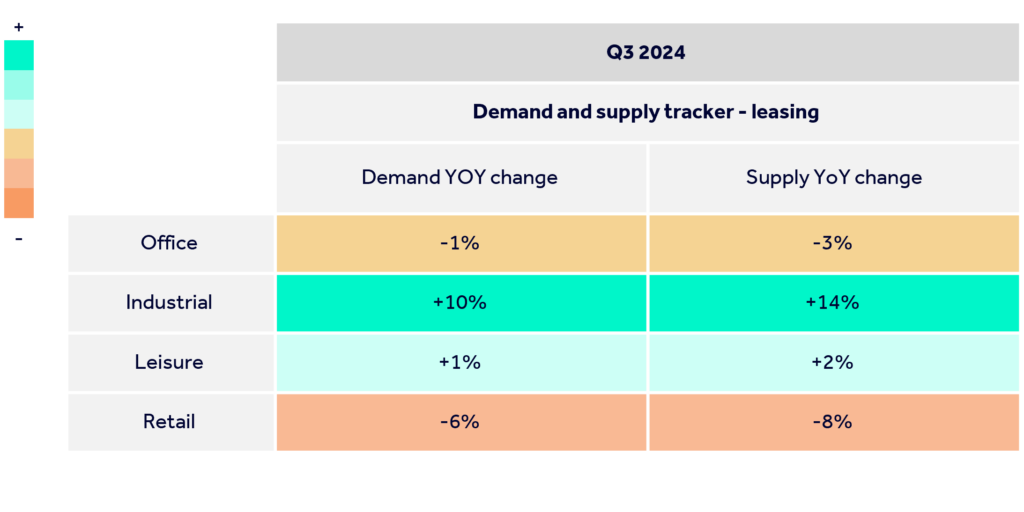
Key takeaways
▲10%
Industrial has seen a 10% increase in demand this quarter compared with a year ago, and is again the strongest performing sector
▼6%
Retail is the weakest performing sector this quarter, with a 6% decrease in demand compared with the same period a year ago
▲14%
The industrial sector continues to see the biggest boost in available supply, with the level of listings 14% higher than last year
Industrial demand
Retail demand
London office demand
Sector summaries
Office
- Demand in the office sector is down by 1% compared to Q3 2023, while supply is down by 3%.
- Serviced offices continue to buck the trend, and demand is up by 11% compared with this time last year in this sub-sector
- Meanwhile, supply in the serviced office sector is up by 4%
Industrial
- Demand for industrial space is up by 10% this quarter compared to the same period last year, while supply is up by 14%
- Warehouses and self storage units are two significant drivers of this quarter’s double digit increase in demand versus last year
- Supply in the light industrial sector is up by 11% versus last year, while warehouse listings are up by 19%
Leisure
- In the leisure sector, demand returns to positive growth at +1% on this time last year, while on the supply side it is +2%
- Pubs at +29% in terms of demand vs last year, is a key driver of the positive trend this quarter
- The increase in available listings comes from a mix of areas this quarter
Retail
- Demand for retail spaces to lease is down by 6% on Q3 2023, while supply is down by 8%. It’s the weakest performing sector versus last year, though trends have improved since Q2
- Out of town retail is a key contributor to this quarter’s demand trends
- Demand for shopping centres bucks the trend, with demand up by 44% on the same time last year
Investment market: data at a glance and key takeaways
Data at a glance
Key takeaways
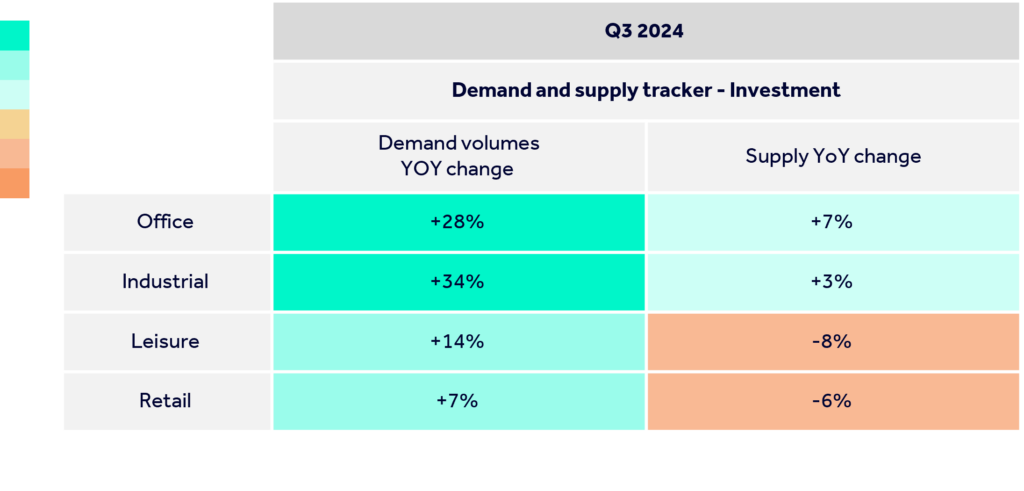
▲34%
Industrial is the strongest performing sector, with a 34% increase in demand
▲7%
Retail is the weakest performing sector, but still with a 7% increase in demand
▲7%
The office sector has seen the biggest increase in available supply, with the level of listings 7% higher than Q3 last year
Investment market: sector summaries
Office
- Demand is up by 28% compared with Q3 2023, while supply is up by 7%
- Both demand and supply trends improve from last quarter
Industrial
- Demand for industrial space is up by 34% compared to this time last year, while supply is up by 3%
- Industrial continues to be the best performing sector, and the sharp increase in demand versus this time last year comes from a mix of areas
- Light industrial units and warehouses are two of the key contributors to the increase in supply this quarter versus last year
Leisure
- Demand is up by 14% in the leisure sector compared with this time last year, while the number of listings is down by 8%
- The positive growth in demand this quarter against this time last year comes from a mix of areas
- A decline in restaurant and café listings are two key drivers behind the overall drop in listings vs last year
Retail
- Retail demand is up by 7% this quarter compared to the same period last year, while supply is down by 6%
- Demand has improved against last year compared with Q2, however supply trends have headed downwards
- An increase in demand for high street retail units is a key reason for this quarter’s overall positive growth in demand