
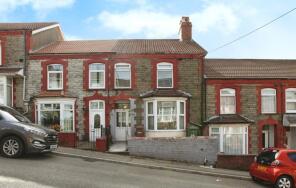
House Prices in Abertridwr
House prices in Abertridwr have an overall average of £170,069 over the last year.
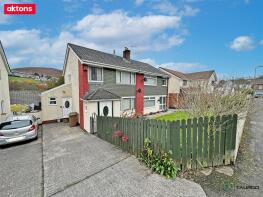
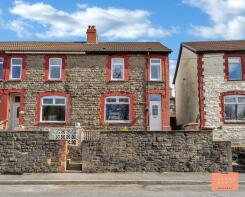
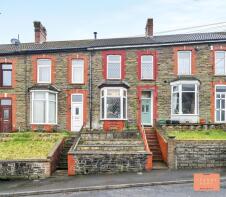
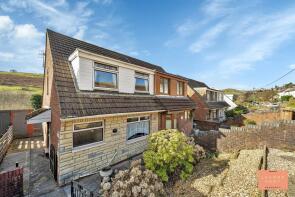
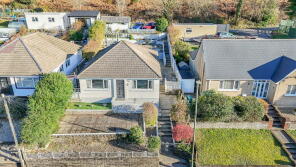
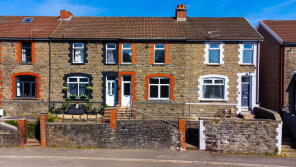
The majority of properties sold in Abertridwr during the last year were terraced properties, selling for an average price of £158,981. Semi-detached properties sold for an average of £180,583, with detached properties fetching £248,833.
Overall, the historical sold prices in Abertridwr over the last year were 6% down on the previous year and 2% down on the 2022 peak of £173,269.
Properties Sold
51, Graig-y-fedw, Caerphilly CF83 4AR
| Today | See what it's worth now |
| 7 Nov 2025 | £195,000 |
| 18 May 2007 | £130,000 |
9, High Street, Caerphilly CF83 4DD
| Today | See what it's worth now |
| 7 Nov 2025 | £170,000 |
| 19 Sep 2012 | £85,500 |
No other historical records.
2, Edward Terrace, Caerphilly CF83 4FL

| Today | See what it's worth now |
| 31 Oct 2025 | £94,000 |
| 15 Jan 2010 | £67,000 |
158 Bramble Cottage, Thomas Street, Caerphilly CF83 4BB
| Today | See what it's worth now |
| 28 Oct 2025 | £325,000 |
| 20 Jul 2001 | £78,500 |
No other historical records.
4, Hendre Road, Caerphilly CF83 4DT
| Today | See what it's worth now |
| 23 Oct 2025 | £163,000 |
| 3 Sep 2021 | £148,000 |
20, Bryngelli Terrace, Caerphilly CF83 4FF
| Today | See what it's worth now |
| 13 Oct 2025 | £168,000 |
| 26 Jan 2007 | £92,500 |
No other historical records.
50, Ilan Road, Caerphilly CF83 4EB
| Today | See what it's worth now |
| 3 Oct 2025 | £140,000 |
| 30 Jun 2005 | £78,500 |
12, Ilan Road, Caerphilly CF83 4EA
| Today | See what it's worth now |
| 25 Sep 2025 | £170,000 |
| 27 May 2022 | £150,000 |
25, Upper Francis Street, Caerphilly CF83 4DU
| Today | See what it's worth now |
| 19 Sep 2025 | £157,000 |
| 28 Jan 2005 | £83,000 |
No other historical records.
22, Aberfawr Terrace, Abertridwr CF83 4EL
| Today | See what it's worth now |
| 19 Sep 2025 | £182,500 |
No other historical records.
114, High Street, Caerphilly CF83 4FE
| Today | See what it's worth now |
| 18 Aug 2025 | £165,000 |
| 9 Jun 2021 | £115,000 |
18, Church Road, Caerphilly CF83 4DL
| Today | See what it's worth now |
| 15 Aug 2025 | £170,000 |
| 22 Aug 2022 | £140,000 |
No other historical records.
38, Graig-y-fedw, Abertridwr CF83 4AR
| Today | See what it's worth now |
| 8 Aug 2025 | £180,000 |
No other historical records.
24, Hendre Road, Caerphilly CF83 4DT


| Today | See what it's worth now |
| 7 Aug 2025 | £130,000 |
| 1 Sep 2004 | £94,950 |
No other historical records.
8, Hendre Road, Caerphilly CF83 4DT

| Today | See what it's worth now |
| 25 Jul 2025 | £160,000 |
| 1 Aug 2017 | £93,000 |
24, Edward Terrace, Caerphilly CF83 4FL
| Today | See what it's worth now |
| 25 Jul 2025 | £150,000 |
| 20 May 2022 | £120,000 |
17, Eglwysilan Way, Caerphilly CF83 4EQ
| Today | See what it's worth now |
| 23 Jul 2025 | £116,000 |
| 9 Dec 2010 | £81,000 |
No other historical records.
20, The Garth, Caerphilly CF83 4ES

| Today | See what it's worth now |
| 18 Jul 2025 | £181,000 |
| 2 Feb 2023 | £148,000 |
5, Gelli Terrace, Senghenydd CF83 4FQ

| Today | See what it's worth now |
| 14 Jul 2025 | £60,000 |
No other historical records.
184, Caerphilly Road, Caerphilly CF83 4FX
| Today | See what it's worth now |
| 14 Jul 2025 | £187,500 |
| 12 Aug 2022 | £85,000 |
39, Lower Francis Street, Caerphilly CF83 4DW

| Today | See what it's worth now |
| 10 Jul 2025 | £165,000 |
| 12 Jun 2012 | £74,000 |
No other historical records.
36, The Garth, Caerphilly CF83 4ES
| Today | See what it's worth now |
| 27 Jun 2025 | £248,000 |
| 15 Oct 2004 | £165,000 |
Bryngwyn, Graig-y-fedw, Caerphilly CF83 4AS
| Today | See what it's worth now |
| 26 Jun 2025 | £250,000 |
| 17 Aug 2018 | £168,000 |
102, High Street, Caerphilly CF83 4FE
| Today | See what it's worth now |
| 20 Jun 2025 | £165,000 |
| 10 Dec 2002 | £48,500 |
No other historical records.
3, High Street, Caerphilly CF83 4DD
| Today | See what it's worth now |
| 13 Jun 2025 | £170,000 |
| 4 Aug 2017 | £109,000 |
Source Acknowledgement: © Crown copyright. England and Wales house price data is publicly available information produced by the HM Land Registry.This material was last updated on 4 February 2026. It covers the period from 1 January 1995 to 24 December 2025 and contains property transactions which have been registered during that period. Contains HM Land Registry data © Crown copyright and database right 2026. This data is licensed under the Open Government Licence v3.0.
Disclaimer: Rightmove.co.uk provides this HM Land Registry data "as is". The burden for fitness of the data relies completely with the user and is provided for informational purposes only. No warranty, express or implied, is given relating to the accuracy of content of the HM Land Registry data and Rightmove does not accept any liability for error or omission. If you have found an error with the data or need further information please contact HM Land Registry.
Permitted Use: Viewers of this Information are granted permission to access this Crown copyright material and to download it onto electronic, magnetic, optical or similar storage media provided that such activities are for private research, study or in-house use only. Any other use of the material requires the formal written permission of Land Registry which can be requested from us, and is subject to an additional licence and associated charge.
Map data ©OpenStreetMap contributors.
Rightmove takes no liability for your use of, or reliance on, Rightmove's Instant Valuation due to the limitations of our tracking tool listed here. Use of this tool is taken entirely at your own risk. All rights reserved.