
House Prices in B26
House prices in B26 have an overall average of £251,049 over the last year.
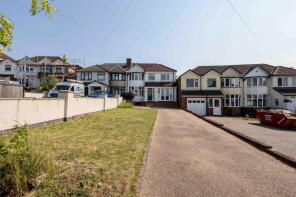
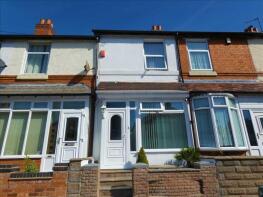
The majority of properties sold in B26 during the last year were semi-detached properties, selling for an average price of £258,857. Terraced properties sold for an average of £242,441, with flats fetching £125,474.
Overall, the historical sold prices in B26 over the last year were 6% up on the previous year and 11% up on the 2023 peak of £226,442.
Properties Sold
12, Aldershaw Road, Birmingham B26 1HJ
| Today | See what it's worth now |
| 28 Apr 2026 | £282,500 |
| 19 Feb 2016 | £170,000 |
100, Cockshut Hill, Birmingham B26 2HU
| Today | See what it's worth now |
| 24 Apr 2026 | £230,000 |
| 1 Jul 2019 | £146,000 |
150, Brays Road, Birmingham B26 2PP
| Today | See what it's worth now |
| 17 Apr 2026 | £177,500 |
| 29 Jan 2016 | £120,000 |
Extensions and planning permission in B26
See planning approval stats, extension build costs and value added estimates.

2471, Coventry Road, Sheldon, Birmingham B26 3PP
| Today | See what it's worth now |
| 16 Apr 2026 | £415,000 |
| 9 Sep 2016 | £290,000 |
No other historical records.
283, Barrows Lane, Sheldon, Birmingham B26 1RE
| Today | See what it's worth now |
| 16 Apr 2026 | £355,000 |
| 5 Apr 2007 | £192,500 |
No other historical records.
29, Silvermere Road, Birmingham B26 3XA

| Today | See what it's worth now |
| 14 Apr 2026 | £185,000 |
| 4 Sep 2020 | £146,000 |
52, Vibart Road, Birmingham B26 2AD
| Today | See what it's worth now |
| 14 Apr 2026 | £355,000 |
| 27 Nov 2014 | £229,000 |
89, Church Road, Sheldon, Birmingham B26 3UB

| Today | See what it's worth now |
| 13 Apr 2026 | £96,605 |
| 2 Oct 2019 | £210,000 |
11, Rosecroft Road, Birmingham B26 3XU
| Today | See what it's worth now |
| 10 Apr 2026 | £256,000 |
| 1 Dec 2000 | £79,000 |
No other historical records.
32, Welford Avenue, Birmingham B26 2LD
| Today | See what it's worth now |
| 2 Apr 2026 | £286,000 |
| 25 Oct 1996 | £60,000 |
No other historical records.
Apartment 201, 1, Wagon Lane, Birmingham B26 3FN
| Today | See what it's worth now |
| 2 Apr 2026 | £165,000 |
No other historical records.
32, Beverley Grove, Birmingham B26 3HT
| Today | See what it's worth now |
| 31 Mar 2026 | £65,000 |
No other historical records.
19, Rosecroft Road, Birmingham B26 3XU
| Today | See what it's worth now |
| 27 Mar 2026 | £285,000 |
No other historical records.
340, Clay Lane, Birmingham B26 1ES
| Today | See what it's worth now |
| 27 Mar 2026 | £225,000 |
No other historical records.
5a, Queens Road, Stechford And Yardley North, Birmingham B26 2AA
| Today | See what it's worth now |
| 27 Mar 2026 | £50,000 |
| 13 Jan 2023 | £60,000 |
161, Sheldon Heath Road, Sheldon, Birmingham B26 2DP
| Today | See what it's worth now |
| 27 Mar 2026 | £255,000 |
| 8 Jun 2018 | £165,000 |
128, Moat Lane, Stechford And Yardley North, Birmingham B26 1TS

| Today | See what it's worth now |
| 26 Mar 2026 | £328,000 |
| 28 Apr 2014 | £152,000 |
No other historical records.
405, Clay Lane, Birmingham B26 1ET
| Today | See what it's worth now |
| 26 Mar 2026 | £415,000 |
| 6 Jun 1997 | £64,600 |
No other historical records.
91, Whitecroft Road, Birmingham B26 3RJ
| Today | See what it's worth now |
| 23 Mar 2026 | £271,500 |
| 23 Mar 2026 | £271,500 |
386, Clay Lane, Birmingham B26 1EU
| Today | See what it's worth now |
| 20 Mar 2026 | £285,000 |
No other historical records.
49, Mardon Road, Birmingham B26 3ER
| Today | See what it's worth now |
| 16 Mar 2026 | £350,000 |
| 12 May 2017 | £265,500 |
16, Boyne Road, Birmingham B26 2QS
| Today | See what it's worth now |
| 12 Mar 2026 | £53,760 |
No other historical records.
30, Welford Avenue, Birmingham B26 2LD

| Today | See what it's worth now |
| 12 Mar 2026 | £265,000 |
No other historical records.

Source Acknowledgement: © Crown copyright. England and Wales house price data is publicly available information produced by the HM Land Registry.This material was last updated on 9 July 2026. It covers the period from 1 January 1995 to 30 April 2026 and contains property transactions which have been registered during that period. Contains HM Land Registry data © Crown copyright and database right 2026. This data is licensed under the Open Government Licence v3.0.
Disclaimer: Rightmove.co.uk provides this HM Land Registry data "as is". The burden for fitness of the data relies completely with the user and is provided for informational purposes only. No warranty, express or implied, is given relating to the accuracy of content of the HM Land Registry data and Rightmove does not accept any liability for error or omission. If you have found an error with the data or need further information please contact HM Land Registry.
Permitted Use: Viewers of this Information are granted permission to access this Crown copyright material and to download it onto electronic, magnetic, optical or similar storage media provided that such activities are for private research, study or in-house use only. Any other use of the material requires the formal written permission of Land Registry which can be requested from us, and is subject to an additional licence and associated charge.
Rightmove takes no liability for your use of, or reliance on, Rightmove's Instant Valuation due to the limitations of our tracking tool listed here. Use of this tool is taken entirely at your own risk. All rights reserved.