
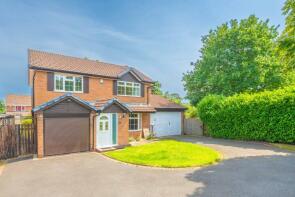
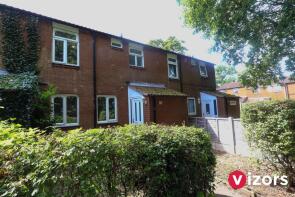
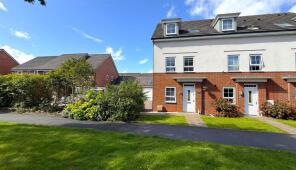
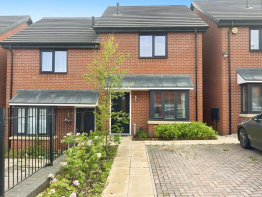
House Prices in B38
House prices in B38 have an overall average of £260,913 over the last year.
The majority of properties sold in B38 during the last year were semi-detached properties, selling for an average price of £280,476. Terraced properties sold for an average of £243,550, with flats fetching £122,474.
Overall, the historical sold prices in B38 over the last year were 3% up on the previous year and similar to the 2023 peak of £259,543.
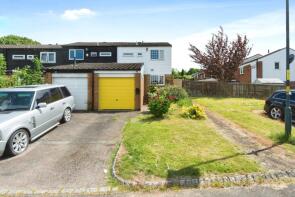
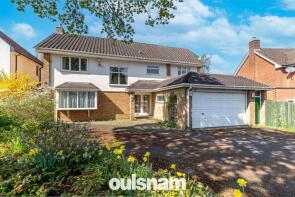
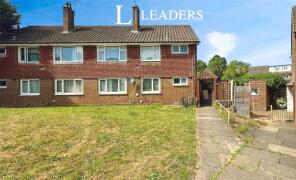
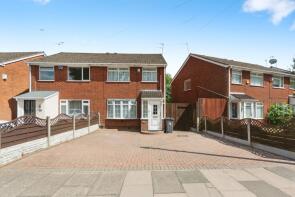
Properties Sold
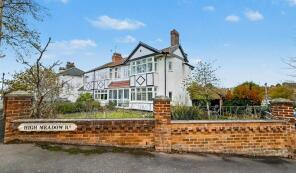
1, High Meadow Road, Birmingham B38 9AP
| Today | See what it's worth now |
| 24 Apr 2026 | £268,000 |
| 17 Dec 2015 | £163,500 |
32, Legging Road, Birmingham B38 9ER
| Today | See what it's worth now |
| 24 Apr 2026 | £280,000 |
| 26 Jun 2020 | £235,995 |
No other historical records.
16, Hayle Close, Birmingham B38 0BE

| Today | See what it's worth now |
| 16 Apr 2026 | £290,000 |
| 26 Jan 2024 | £250,000 |
No other historical records.
Extensions and planning permission in B38
See planning approval stats, extension build costs and value added estimates.

43, Nearhill Road, Birmingham B38 8LA

| Today | See what it's worth now |
| 31 Mar 2026 | £220,000 |
| 23 Jun 2010 | £110,000 |
No other historical records.
120, Redditch Road, Kings Norton, Birmingham B38 8RD
| Today | See what it's worth now |
| 31 Mar 2026 | £358,000 |
No other historical records.
134, Redditch Road, Kings Norton, Birmingham B38 8RD

| Today | See what it's worth now |
| 31 Mar 2026 | £290,000 |
| 18 May 2018 | £230,000 |
No other historical records.
9, Lynfield Close, Birmingham B38 9RL

| Today | See what it's worth now |
| 27 Mar 2026 | £209,000 |
| 24 Nov 2006 | £115,000 |
20, Meadow Hill Road, Birmingham B38 8DD
| Today | See what it's worth now |
| 27 Mar 2026 | £672,500 |
No other historical records.
53, Calverley Road, Birmingham B38 8PN
| Today | See what it's worth now |
| 23 Mar 2026 | £272,500 |
| 27 Jul 1998 | £60,000 |
No other historical records.
2, Ashcott Close, Birmingham B38 8YS
| Today | See what it's worth now |
| 20 Mar 2026 | £245,000 |
| 22 Jun 2021 | £217,000 |
301, 58 Grosvenor Court, The Green, Kings Norton, Birmingham B38 8RU
| Today | See what it's worth now |
| 20 Mar 2026 | £135,000 |
| 31 May 2013 | £95,000 |
14, Braid Close, Birmingham B38 8YB
| Today | See what it's worth now |
| 16 Mar 2026 | £194,000 |
| 22 Mar 2018 | £139,000 |
45, Greenway Gardens, Birmingham B38 9RY
| Today | See what it's worth now |
| 13 Mar 2026 | £195,000 |
| 29 Jul 2022 | £173,150 |
76, Beaks Hill Road, Birmingham B38 8BN
| Today | See what it's worth now |
| 12 Mar 2026 | £600,000 |
| 6 May 2016 | £510,000 |
16, Downland Close, Birmingham B38 8QT
| Today | See what it's worth now |
| 4 Mar 2026 | £110,000 |
| 5 Oct 2022 | £105,000 |
No other historical records.
147, Masshouse Lane, Kings Norton, Birmingham B38 9AD
| Today | See what it's worth now |
| 2 Mar 2026 | £260,000 |
No other historical records.
11, Kempsey Covert, Birmingham B38 9TP
| Today | See what it's worth now |
| 27 Feb 2026 | £176,000 |
| 10 Mar 2017 | £105,000 |
41, Holly Dell, Birmingham B38 0AG
| Today | See what it's worth now |
| 27 Feb 2026 | £387,500 |
| 26 Apr 2024 | £399,950 |
No other historical records.
28, Glenroyde, Birmingham B38 9UT
| Today | See what it's worth now |
| 27 Feb 2026 | £177,000 |
| 13 Jun 2013 | £68,000 |
No other historical records.
83c, Walkers Heath Road, Birmingham B38 0AP
| Today | See what it's worth now |
| 27 Feb 2026 | £295,000 |
| 25 Sep 2015 | £227,950 |
No other historical records.
26, Legging Road, Birmingham B38 9ER
| Today | See what it's worth now |
| 26 Feb 2026 | £225,000 |
| 19 Dec 2019 | £185,995 |
No other historical records.
88, Calverley Road, Birmingham B38 8PN
| Today | See what it's worth now |
| 26 Feb 2026 | £286,000 |
| 15 Oct 2018 | £230,000 |
679, Redditch Road, Kings Norton, Birmingham B38 8LN
| Today | See what it's worth now |
| 23 Feb 2026 | £234,000 |
| 8 Sep 2023 | £230,000 |
No other historical records.
Source Acknowledgement: © Crown copyright. England and Wales house price data is publicly available information produced by the HM Land Registry.This material was last updated on 9 July 2026. It covers the period from 1 January 1995 to 30 April 2026 and contains property transactions which have been registered during that period. Contains HM Land Registry data © Crown copyright and database right 2026. This data is licensed under the Open Government Licence v3.0.
Disclaimer: Rightmove.co.uk provides this HM Land Registry data "as is". The burden for fitness of the data relies completely with the user and is provided for informational purposes only. No warranty, express or implied, is given relating to the accuracy of content of the HM Land Registry data and Rightmove does not accept any liability for error or omission. If you have found an error with the data or need further information please contact HM Land Registry.
Permitted Use: Viewers of this Information are granted permission to access this Crown copyright material and to download it onto electronic, magnetic, optical or similar storage media provided that such activities are for private research, study or in-house use only. Any other use of the material requires the formal written permission of Land Registry which can be requested from us, and is subject to an additional licence and associated charge.
Rightmove takes no liability for your use of, or reliance on, Rightmove's Instant Valuation due to the limitations of our tracking tool listed here. Use of this tool is taken entirely at your own risk. All rights reserved.