
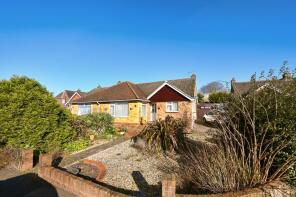
House Prices in BN43
House prices in BN43 have an overall average of £454,077 over the last year.
The majority of properties sold in BN43 during the last year were semi-detached properties, selling for an average price of £493,824. Flats sold for an average of £252,747, with detached properties fetching £651,059.
Overall, the historical sold prices in BN43 over the last year were 2% up on the previous year and 5% down on the 2022 peak of £478,332.
Properties Sold
Flat 2, 32a, East Street, Shoreham-by-sea BN43 5ZD

| Today | See what it's worth now |
| 17 Apr 2026 | £202,500 |
| 14 Jul 2011 | £146,000 |
No other historical records.
156, Greenacres, Shoreham-by-sea BN43 5XL
| Today | See what it's worth now |
| 31 Mar 2026 | £480,000 |
| 8 Jan 2024 | £510,000 |
17, Oakland Court, Buckingham Road, Shoreham-by-sea BN43 5TZ

| Today | See what it's worth now |
| 30 Mar 2026 | £125,000 |
| 24 Jul 2019 | £145,000 |
Extensions and planning permission in BN43
See planning approval stats, extension build costs and value added estimates.

100, Gordon Road, Shoreham-by-sea BN43 6WE
| Today | See what it's worth now |
| 27 Mar 2026 | £305,000 |
| 6 May 2003 | £178,000 |
4, Downside Close, Shoreham-by-sea BN43 6AF
| Today | See what it's worth now |
| 27 Mar 2026 | £525,000 |
| 28 Feb 2014 | £290,000 |
No other historical records.
6, Riverside House, High Street, Shoreham-by-sea BN43 5DW

| Today | See what it's worth now |
| 27 Mar 2026 | £214,000 |
| 17 May 2017 | £235,000 |
2, Orchard Close, Shoreham-by-sea BN43 5UT
| Today | See what it's worth now |
| 27 Mar 2026 | £432,500 |
| 26 Feb 2015 | £332,000 |
2, Ravensbourne Close, Shoreham-by-sea BN43 6AD
| Today | See what it's worth now |
| 23 Mar 2026 | £495,000 |
| 18 Mar 2014 | £336,000 |
No other historical records.
17, Cheal Close, Shoreham-by-sea BN43 5RQ

| Today | See what it's worth now |
| 20 Mar 2026 | £545,000 |
| 12 Oct 2023 | £560,000 |
20, Sorlings Reach, Sussex Wharf, Shoreham-by-sea BN43 5PD
| Today | See what it's worth now |
| 19 Mar 2026 | £202,500 |
| 2 May 2023 | £240,000 |
38, Marline Court, Little High Street, Shoreham-by-sea BN43 5EQ
| Today | See what it's worth now |
| 16 Mar 2026 | £220,000 |
| 23 Feb 2006 | £205,000 |
No other historical records.
79, Connaught Avenue, Shoreham-by-sea BN43 5WL
| Today | See what it's worth now |
| 13 Mar 2026 | £450,000 |
No other historical records.
3, Montague Close, Shoreham-by-sea BN43 6EF

| Today | See what it's worth now |
| 6 Mar 2026 | £505,000 |
| 11 Nov 2020 | £392,500 |
Flat 6, 4 Heron View, Southlands Way, Shoreham-by-sea BN43 6AU
| Today | See what it's worth now |
| 4 Mar 2026 | £222,500 |
| 13 Sep 2016 | £205,000 |
39, Southdown Road, Shoreham-by-sea BN43 5AL

| Today | See what it's worth now |
| 27 Feb 2026 | £1,050,000 |
No other historical records.
13, Southdown Road, Shoreham-by-sea BN43 5AL
| Today | See what it's worth now |
| 27 Feb 2026 | £680,000 |
| 3 Dec 1998 | £45,500 |
No other historical records.
23, Ashcroft Close, Shoreham-by-sea BN43 6YR
| Today | See what it's worth now |
| 27 Feb 2026 | £360,000 |
| 23 May 2002 | £42,732 |
No other historical records.
26, Norman Crescent, Shoreham-by-sea BN43 6AH
| Today | See what it's worth now |
| 27 Feb 2026 | £800,000 |
| 31 Mar 2006 | £415,000 |
154, Downside, Shoreham-by-sea BN43 6HD
| Today | See what it's worth now |
| 27 Feb 2026 | £495,000 |
| 30 Aug 2006 | £249,995 |
No other historical records.
15, Beach Green, Shoreham-by-sea BN43 5YG
| Today | See what it's worth now |
| 25 Feb 2026 | £791,000 |
| 30 Sep 1997 | £99,950 |
No other historical records.
49, Riverside Road, Shoreham-by-sea BN43 5RB
| Today | See what it's worth now |
| 25 Feb 2026 | £747,000 |
| 2 Sep 1996 | £46,000 |
169, Old Fort Road, Shoreham-by-sea BN43 5HL
| Today | See what it's worth now |
| 25 Feb 2026 | £779,000 |
| 17 Jun 2014 | £579,950 |
71, Adur Avenue, Shoreham-by-sea BN43 5NL

| Today | See what it's worth now |
| 25 Feb 2026 | £685,000 |
| 12 Apr 2018 | £470,000 |
No other historical records.
Source Acknowledgement: © Crown copyright. England and Wales house price data is publicly available information produced by the HM Land Registry.This material was last updated on 9 July 2026. It covers the period from 1 January 1995 to 30 April 2026 and contains property transactions which have been registered during that period. Contains HM Land Registry data © Crown copyright and database right 2026. This data is licensed under the Open Government Licence v3.0.
Disclaimer: Rightmove.co.uk provides this HM Land Registry data "as is". The burden for fitness of the data relies completely with the user and is provided for informational purposes only. No warranty, express or implied, is given relating to the accuracy of content of the HM Land Registry data and Rightmove does not accept any liability for error or omission. If you have found an error with the data or need further information please contact HM Land Registry.
Permitted Use: Viewers of this Information are granted permission to access this Crown copyright material and to download it onto electronic, magnetic, optical or similar storage media provided that such activities are for private research, study or in-house use only. Any other use of the material requires the formal written permission of Land Registry which can be requested from us, and is subject to an additional licence and associated charge.
Rightmove takes no liability for your use of, or reliance on, Rightmove's Instant Valuation due to the limitations of our tracking tool listed here. Use of this tool is taken entirely at your own risk. All rights reserved.