
House Prices in BS49
House prices in BS49 have an overall average of £393,649 over the last year.
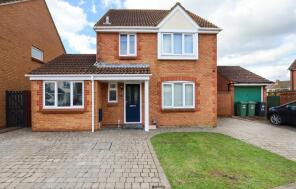
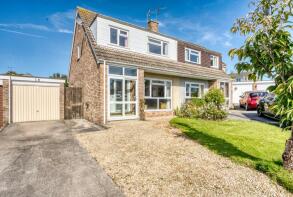
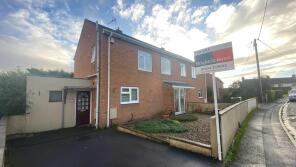
The majority of properties sold in BS49 during the last year were detached properties, selling for an average price of £506,136. Semi-detached properties sold for an average of £348,302, with terraced properties fetching £282,817.
Overall, the historical sold prices in BS49 over the last year were 4% down on the previous year and 5% down on the 2022 peak of £414,601.
Properties Sold
19, Venus Street, Bristol BS49 5HA
| Today | See what it's worth now |
| 16 Apr 2026 | £360,000 |
| 6 Apr 2016 | £245,000 |
3, Mayors Road, Bristol BS49 4GG
| Today | See what it's worth now |
| 27 Mar 2026 | £425,000 |
| 27 Sep 2021 | £447,500 |
No other historical records.
27, Venus Street, Bristol BS49 5HA
| Today | See what it's worth now |
| 26 Mar 2026 | £475,000 |
| 31 Aug 2017 | £297,500 |
Extensions and planning permission in BS49
See planning approval stats, extension build costs and value added estimates.

79, Claverham Road, Yatton, Claverham BS49 4LD
| Today | See what it's worth now |
| 6 Mar 2026 | £450,000 |
No other historical records.
16, Avalon Close, Bristol BS49 4AQ
| Today | See what it's worth now |
| 27 Feb 2026 | £285,000 |
| 26 Oct 2007 | £182,500 |
No other historical records.
36, Elm Close, Bristol BS49 4EL

| Today | See what it's worth now |
| 27 Feb 2026 | £150,000 |
| 2 Oct 2020 | £252,000 |
No other historical records.
24, Mulberry Road, Bristol BS49 5HD
| Today | See what it's worth now |
| 25 Feb 2026 | £415,000 |
| 15 Mar 2013 | £205,000 |
No other historical records.
28, Bishops Road, Bristol BS49 4NG
| Today | See what it's worth now |
| 19 Feb 2026 | £381,000 |
| 9 Sep 2005 | £249,500 |
18, Stonewell Grove, Congresbury BS49 5DR
| Today | See what it's worth now |
| 13 Feb 2026 | £325,000 |
No other historical records.
50, Southlands Way, Bristol BS49 5BP
| Today | See what it's worth now |
| 30 Jan 2026 | £300,000 |
| 13 Dec 2019 | £215,000 |
No other historical records.
14 Dorrington, Stonewell Lane, Bristol BS49 5DL
| Today | See what it's worth now |
| 30 Jan 2026 | £670,000 |
| 25 Oct 2005 | £214,000 |
No other historical records.
34, Rectory Way, Bristol BS49 4HQ
| Today | See what it's worth now |
| 27 Jan 2026 | £258,000 |
| 6 Mar 2015 | £172,500 |
No other historical records.
21, Dysons Close, Bristol BS49 4DP
| Today | See what it's worth now |
| 23 Jan 2026 | £410,000 |
| 29 Jun 2011 | £275,000 |
No other historical records.
317, Stowey Road, Bristol BS49 4QT

| Today | See what it's worth now |
| 9 Jan 2026 | £277,500 |
| 22 Jan 2021 | £250,000 |
209, Mendip Road, Bristol BS49 4ED
| Today | See what it's worth now |
| 9 Jan 2026 | £355,000 |
| 29 Jun 2015 | £208,000 |
4, Glen Yeo Terrace, Bristol BS49 5EA
| Today | See what it's worth now |
| 9 Jan 2026 | £385,000 |
| 9 Aug 2013 | £147,500 |
32, Stowey Road, Bristol BS49 4HX
| Today | See what it's worth now |
| 19 Dec 2025 | £490,000 |
| 16 Jun 2006 | £237,000 |
92, Wemberham Lane, Bristol BS49 4BP
| Today | See what it's worth now |
| 19 Dec 2025 | £370,000 |
| 24 Jun 2016 | £220,000 |
No other historical records.
1, 26 Village Mews, High Street, Bristol BS49 4JA
| Today | See what it's worth now |
| 19 Dec 2025 | £215,000 |
| 10 Aug 2016 | £215,000 |
No other historical records.
25, Rectory Drive, Bristol BS49 4HF
| Today | See what it's worth now |
| 18 Dec 2025 | £295,000 |
| 17 Oct 2003 | £125,000 |
29, Barn Owl Road, Bristol BS49 4GH
| Today | See what it's worth now |
| 15 Dec 2025 | £402,500 |
| 4 Jan 2023 | £399,995 |
No other historical records.
27, Barn Owl Road, Bristol BS49 4GH
| Today | See what it's worth now |
| 15 Dec 2025 | £339,000 |
| 5 Aug 2022 | £330,000 |
No other historical records.
12, Binhay Road, Yatton BS49 4HD
| Today | See what it's worth now |
| 15 Dec 2025 | £272,500 |
No other historical records.

Source Acknowledgement: © Crown copyright. England and Wales house price data is publicly available information produced by the HM Land Registry.This material was last updated on 9 July 2026. It covers the period from 1 January 1995 to 30 April 2026 and contains property transactions which have been registered during that period. Contains HM Land Registry data © Crown copyright and database right 2026. This data is licensed under the Open Government Licence v3.0.
Disclaimer: Rightmove.co.uk provides this HM Land Registry data "as is". The burden for fitness of the data relies completely with the user and is provided for informational purposes only. No warranty, express or implied, is given relating to the accuracy of content of the HM Land Registry data and Rightmove does not accept any liability for error or omission. If you have found an error with the data or need further information please contact HM Land Registry.
Permitted Use: Viewers of this Information are granted permission to access this Crown copyright material and to download it onto electronic, magnetic, optical or similar storage media provided that such activities are for private research, study or in-house use only. Any other use of the material requires the formal written permission of Land Registry which can be requested from us, and is subject to an additional licence and associated charge.
Rightmove takes no liability for your use of, or reliance on, Rightmove's Instant Valuation due to the limitations of our tracking tool listed here. Use of this tool is taken entirely at your own risk. All rights reserved.