
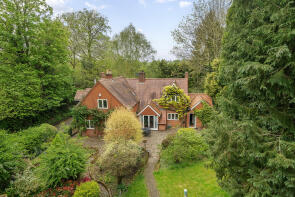
House Prices in Belbroughton
House prices in Belbroughton have an overall average of £632,550 over the last year.
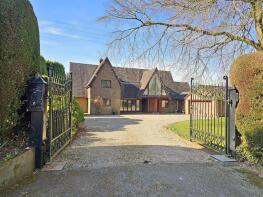
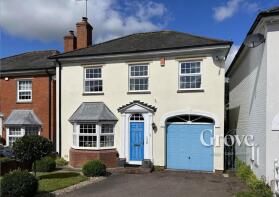
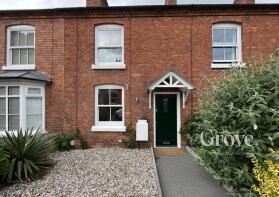
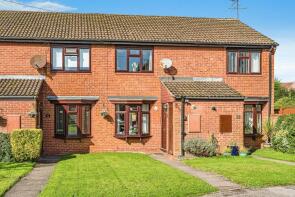
The majority of properties sold in Belbroughton during the last year were detached properties, selling for an average price of £1,110,750. Terraced properties sold for an average of £308,125, with semi-detached properties fetching £325,000.
Overall, the historical sold prices in Belbroughton over the last year were 24% up on the previous year and 10% up on the 2023 peak of £574,765.
Properties Sold
Springfield House, Dark Lane, Stourbridge DY9 9SS


| Today | See what it's worth now |
| 9 Dec 2025 | £1,865,000 |
| 13 Jan 2012 | £999,000 |
37a, High Street, Stourbridge DY9 9ST

| Today | See what it's worth now |
| 6 Nov 2025 | £200,000 |
| 25 May 2000 | £96,000 |
No other historical records.
Woodland House, Woodfield Lane, Romsley, Bell Heath B62 0LR
| Today | See what it's worth now |
| 29 Sep 2025 | £1,190,000 |
No other historical records.
30, Nash Lane, Stourbridge DY9 9SW
| Today | See what it's worth now |
| 24 Sep 2025 | £528,000 |
| 22 Sep 2004 | £390,000 |
65, High Street, Stourbridge DY9 9ST
| Today | See what it's worth now |
| 11 Sep 2025 | £430,000 |
| 4 Jun 2014 | £215,000 |
No other historical records.
25, Woodhouse Orchard, Stourbridge DY9 9TQ
| Today | See what it's worth now |
| 4 Sep 2025 | £250,000 |
| 14 Mar 2025 | £250,000 |
48, Hartle Lane, Belbroughton DY9 9TJ

| Today | See what it's worth now |
| 4 Aug 2025 | £325,000 |
| 4 Aug 2025 | £325,000 |
No other historical records.
Skinners Cottage, Barrow Hill Lane, Drayton, Stourbridge DY9 0BN
| Today | See what it's worth now |
| 29 Jul 2025 | £860,000 |
| 14 Jul 2014 | £620,000 |
Sherwood Cottage, Drayton Terrace, Drayton Road, Drayton, Belbroughton DY9 0BW
| Today | See what it's worth now |
| 18 Jun 2025 | £352,500 |
| 19 Dec 2007 | £265,000 |
The Pines, Heath End Road, Stourbridge DY9 9XG
| Today | See what it's worth now |
| 31 Mar 2025 | £910,000 |
| 30 Jun 2017 | £530,000 |
Gorse Green Barn, Gorse Green Lane, Belbroughton DY9 9UH
| Today | See what it's worth now |
| 31 Mar 2025 | £840,000 |
No other historical records.
81, High Street, Belbroughton DY9 9ST
| Today | See what it's worth now |
| 28 Mar 2025 | £720,000 |
No other historical records.
10, Pinchers Close, Stourbridge DY9 9SX
| Today | See what it's worth now |
| 27 Mar 2025 | £635,000 |
| 5 Feb 2021 | £530,000 |
37, Nash Lane, Stourbridge DY9 9SW
| Today | See what it's worth now |
| 27 Mar 2025 | £620,000 |
| 8 Apr 2022 | £550,000 |
No other historical records.
2, Pinchers Close, Belbroughton DY9 9SX
| Today | See what it's worth now |
| 14 Mar 2025 | £430,000 |
No other historical records.
Overbrook House, Drayton Road, Stourbridge DY9 0DX
| Today | See what it's worth now |
| 21 Feb 2025 | £743,500 |
| 1 Apr 2003 | £399,500 |
No other historical records.
21, Woodhouse Orchard, Stourbridge DY9 9TQ
| Today | See what it's worth now |
| 14 Feb 2025 | £218,000 |
| 7 Jan 2005 | £150,000 |
No other historical records.
28, Yew Tree Avenue, Belbroughton DY9 9SL
| Today | See what it's worth now |
| 14 Feb 2025 | £355,000 |
No other historical records.
Rose Cottage, The Gutter, Belbroughton, Bell Heath DY9 9XB
| Today | See what it's worth now |
| 4 Feb 2025 | £615,000 |
No other historical records.
33, Nash Lane, Stourbridge DY9 9SW
| Today | See what it's worth now |
| 31 Jan 2025 | £455,000 |
| 3 Nov 2017 | £400,000 |
64a, Hartle Lane, Belbroughton DY9 9TJ

| Today | See what it's worth now |
| 17 Jan 2025 | £420,000 |
No other historical records.
2, Bellamy Close, Stourbridge DY9 9AN

| Today | See what it's worth now |
| 6 Jan 2025 | £390,000 |
| 21 Jan 2022 | £375,000 |
No other historical records.
Flat 10, Brookfield House, Hackmans Gate Lane, Stourbridge DY9 0DL

| Today | See what it's worth now |
| 6 Dec 2024 | £245,000 |
| 4 Aug 2010 | £145,000 |
13, Glebe Fields, Stourbridge DY9 9TA

| Today | See what it's worth now |
| 22 Nov 2024 | £266,000 |
| 12 Oct 2007 | £148,400 |
No other historical records.
3, Glebe Fields, Stourbridge DY9 9TA

| Today | See what it's worth now |
| 22 Nov 2024 | £154,000 |
| 20 Sep 2019 | £124,600 |
Source Acknowledgement: © Crown copyright. England and Wales house price data is publicly available information produced by the HM Land Registry.This material was last updated on 4 February 2026. It covers the period from 1 January 1995 to 24 December 2025 and contains property transactions which have been registered during that period. Contains HM Land Registry data © Crown copyright and database right 2026. This data is licensed under the Open Government Licence v3.0.
Disclaimer: Rightmove.co.uk provides this HM Land Registry data "as is". The burden for fitness of the data relies completely with the user and is provided for informational purposes only. No warranty, express or implied, is given relating to the accuracy of content of the HM Land Registry data and Rightmove does not accept any liability for error or omission. If you have found an error with the data or need further information please contact HM Land Registry.
Permitted Use: Viewers of this Information are granted permission to access this Crown copyright material and to download it onto electronic, magnetic, optical or similar storage media provided that such activities are for private research, study or in-house use only. Any other use of the material requires the formal written permission of Land Registry which can be requested from us, and is subject to an additional licence and associated charge.
Map data ©OpenStreetMap contributors.
Rightmove takes no liability for your use of, or reliance on, Rightmove's Instant Valuation due to the limitations of our tracking tool listed here. Use of this tool is taken entirely at your own risk. All rights reserved.