
House Prices in Blagvegate
House prices in Blagvegate have an overall average of £179,092 over the last year.
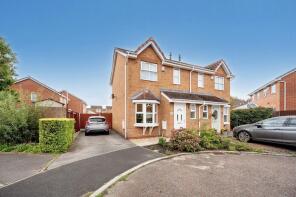
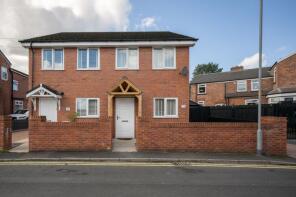
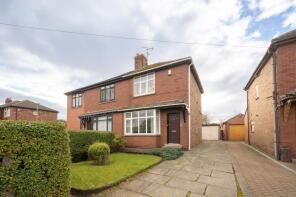
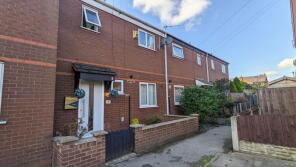
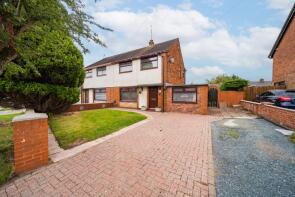
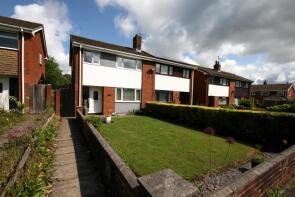
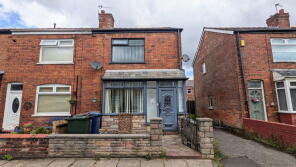
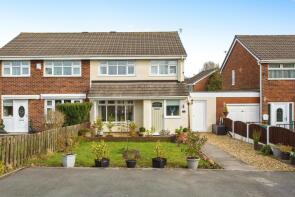
The majority of properties sold in Blagvegate during the last year were terraced properties, selling for an average price of £131,280. Semi-detached properties sold for an average of £190,307, with detached properties fetching £312,320.
Overall, the historical sold prices in Blagvegate over the last year were 12% down on the previous year and 10% up on the 2020 peak of £162,523.
Properties Sold
18, Maiden Close, Skelmersdale WN8 8JL
| Today | See what it's worth now |
| 6 Feb 2026 | £162,000 |
| 29 Apr 2016 | £125,000 |
2b, Bromilow Road, Skelmersdale WN8 8TU
| Today | See what it's worth now |
| 30 Jan 2026 | £175,000 |
| 23 Aug 2024 | £163,000 |
5, Lime Grove, Skelmersdale WN8 8ET

| Today | See what it's worth now |
| 26 Jan 2026 | £180,000 |
| 26 Sep 2022 | £145,000 |
No other historical records.
64, School Lane, Chapel House, Skelmersdale WN8 8EH
| Today | See what it's worth now |
| 15 Jan 2026 | £131,000 |
No other historical records.
9, Marchbank Road, Skelmersdale WN8 8HT
| Today | See what it's worth now |
| 12 Jan 2026 | £152,000 |
| 4 Dec 2000 | £21,375 |
No other historical records.
120, School Lane, Skelmersdale WN8 8PU
| Today | See what it's worth now |
| 19 Dec 2025 | £210,000 |
| 26 Nov 2021 | £160,000 |
No other historical records.
62, Thurcroft Drive, Skelmersdale WN8 8PD
| Today | See what it's worth now |
| 19 Dec 2025 | £195,000 |
| 29 May 2008 | £100,000 |
No other historical records.
7, Wallcroft Street, Skelmersdale WN8 8AW
| Today | See what it's worth now |
| 19 Dec 2025 | £120,000 |
| 15 Feb 2019 | £77,000 |
No other historical records.
24, Berry Street, Skelmersdale WN8 8QZ
| Today | See what it's worth now |
| 18 Dec 2025 | £197,000 |
| 2 Aug 2021 | £137,000 |
12, Ashwall Street, Skelmersdale WN8 8AN
| Today | See what it's worth now |
| 18 Dec 2025 | £135,000 |
| 12 Mar 2014 | £75,000 |
127, Tongbarn, Skelmersdale WN8 8EL
| Today | See what it's worth now |
| 12 Dec 2025 | £110,000 |
| 14 Jul 2017 | £97,000 |
49, Merdale Way, Skelmersdale WN8 8AS
| Today | See what it's worth now |
| 5 Dec 2025 | £370,000 |
| 25 Jun 2020 | £315,995 |
No other historical records.
133, Millbrook Close, Skelmersdale WN8 8QS

| Today | See what it's worth now |
| 5 Dec 2025 | £191,000 |
| 24 Oct 2005 | £102,500 |
21, Witham Road, Skelmersdale WN8 8HW

| Today | See what it's worth now |
| 2 Dec 2025 | £120,000 |
| 8 Dec 2022 | £97,500 |
119, Liverpool Road, Skelmersdale WN8 8BS
| Today | See what it's worth now |
| 2 Dec 2025 | £210,000 |
| 9 Jul 2004 | £108,000 |
23, West Park Close, Skelmersdale WN8 8AY
| Today | See what it's worth now |
| 2 Dec 2025 | £190,000 |
| 27 Jul 2018 | £139,000 |
Brookdale, Slate Lane, Skelmersdale WN8 8UY
| Today | See what it's worth now |
| 28 Nov 2025 | £275,000 |
| 11 Feb 2004 | £165,000 |
No other historical records.
109, Tongbarn, Skelmersdale WN8 8EJ
| Today | See what it's worth now |
| 25 Nov 2025 | £135,000 |
| 6 Mar 2015 | £74,000 |
No other historical records.
26, Willow Drive, Skelmersdale WN8 8PJ
| Today | See what it's worth now |
| 25 Nov 2025 | £210,000 |
No other historical records.
3, Marchbank Road, Skelmersdale WN8 8HT
| Today | See what it's worth now |
| 21 Nov 2025 | £170,000 |
No other historical records.
40, Wheatacre, Skelmersdale WN8 8AJ


| Today | See what it's worth now |
| 21 Nov 2025 | £150,000 |
No other historical records.
49, Thurcroft Drive, Skelmersdale WN8 8PD
| Today | See what it's worth now |
| 21 Nov 2025 | £178,000 |
| 1 Apr 2011 | £118,000 |
No other historical records.
32, Tintagel, Skelmersdale WN8 8PF
| Today | See what it's worth now |
| 14 Nov 2025 | £132,500 |
| 27 May 2005 | £102,000 |
42, Sherrat Street, Skelmersdale WN8 8HE
| Today | See what it's worth now |
| 14 Nov 2025 | £142,000 |
| 6 Oct 2009 | £60,000 |
No other historical records.
80, Tintagel, Skelmersdale WN8 8PF
| Today | See what it's worth now |
| 31 Oct 2025 | £118,000 |
| 7 Sep 2015 | £84,000 |
No other historical records.
Source Acknowledgement: © Crown copyright. England and Wales house price data is publicly available information produced by the HM Land Registry.This material was last updated on 9 April 2026. It covers the period from 1 January 1995 to 27 February 2026 and contains property transactions which have been registered during that period. Contains HM Land Registry data © Crown copyright and database right 2026. This data is licensed under the Open Government Licence v3.0.
Disclaimer: Rightmove.co.uk provides this HM Land Registry data "as is". The burden for fitness of the data relies completely with the user and is provided for informational purposes only. No warranty, express or implied, is given relating to the accuracy of content of the HM Land Registry data and Rightmove does not accept any liability for error or omission. If you have found an error with the data or need further information please contact HM Land Registry.
Permitted Use: Viewers of this Information are granted permission to access this Crown copyright material and to download it onto electronic, magnetic, optical or similar storage media provided that such activities are for private research, study or in-house use only. Any other use of the material requires the formal written permission of Land Registry which can be requested from us, and is subject to an additional licence and associated charge.
Map data ©OpenStreetMap contributors.
Rightmove takes no liability for your use of, or reliance on, Rightmove's Instant Valuation due to the limitations of our tracking tool listed here. Use of this tool is taken entirely at your own risk. All rights reserved.