
House Prices in Blanefield
House prices in Blanefield have an overall average of £396,838 over the last year.
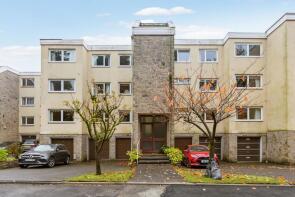
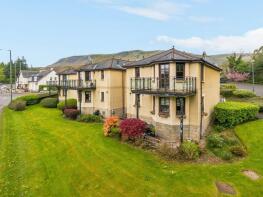
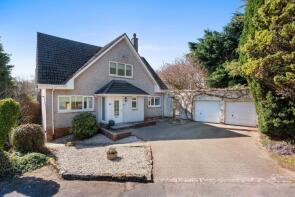
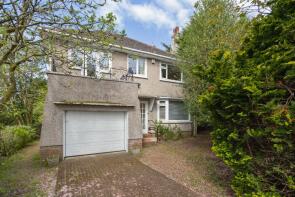
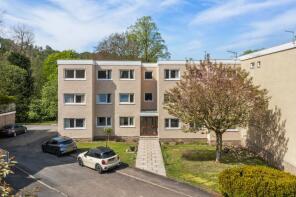
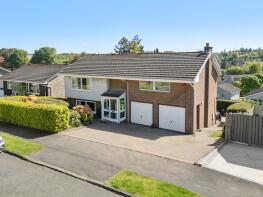
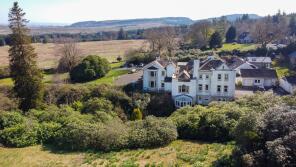
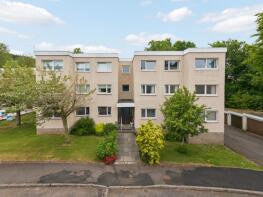
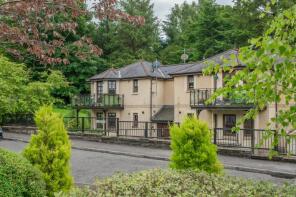
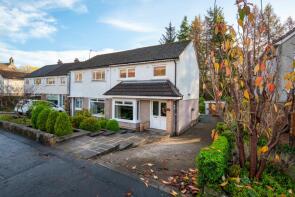
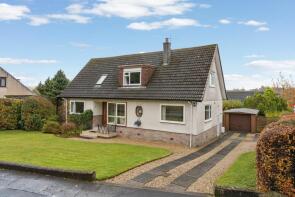
The majority of properties sold in Blanefield during the last year were detached properties, selling for an average price of £574,917. Terraced properties sold for an average of £350,000, with flats fetching £194,786.
Overall, the historical sold prices in Blanefield over the last year were 29% up on the previous year and 34% up on the 2017 peak of £297,128.
Properties Sold
21, Netherblane, Glasgow G63 9JW
| Today | See what it's worth now |
| 8 Dec 2025 | £222,000 |
| 17 Jun 2013 | £149,000 |
No other historical records.
4 6, Wood Place, Glasgow G63 9BB


| Today | See what it's worth now |
| 24 Nov 2025 | £165,000 |
| 22 Nov 2023 | £95,000 |
Block 1 - 3, Station Lofts, Strathblane G63 9BD
| Today | See what it's worth now |
| 27 Oct 2025 | £177,000 |
| 13 Feb 2004 | £135,000 |
No other historical records.
15, Campsie View Drive, Blanefield, Strathblane G63 9JE
| Today | See what it's worth now |
| 24 Oct 2025 | £506,550 |
No other historical records.
1, Kirkhouse Road, Blanefield G63 9BS
| Today | See what it's worth now |
| 21 Oct 2025 | £377,371 |
No other historical records.
Low Auchengillan, Blanefield G63 9AU
| Today | See what it's worth now |
| 19 Sep 2025 | £640,000 |
No other historical records.
23, Craigfern Drive, Glasgow G63 9DP
| Today | See what it's worth now |
| 15 Sep 2025 | £390,000 |
| 1 Feb 2017 | £335,000 |
13, Blane Avenue, Glasgow G63 9HU
| Today | See what it's worth now |
| 11 Sep 2025 | £320,000 |
| 10 Nov 2008 | £225,000 |
No other historical records.
11, Blane Avenue, Glasgow G63 9HU
| Today | See what it's worth now |
| 2 Sep 2025 | £338,750 |
| 5 Nov 2004 | £150,000 |
77, Netherblane, Blanefield G63 9JP
| Today | See what it's worth now |
| 2 Sep 2025 | £190,000 |
No other historical records.
10 Jacaranda, Kirkland Avenue, Glasgow G63 9BZ
| Today | See what it's worth now |
| 25 Aug 2025 | £483,000 |
| 31 Oct 2002 | £95,000 |
No other historical records.
3 Auchineden House, Blanefield G63 9AX
| Today | See what it's worth now |
| 25 Aug 2025 | £325,000 |
| 10 Sep 2002 | £232,250 |
No other historical records.
84, Netherblane, Glasgow G63 9JP
| Today | See what it's worth now |
| 19 Aug 2025 | £200,000 |
| 9 Aug 2024 | £190,000 |
No other historical records.
Block 2 - 4, Station Lofts, Glasgow G63 9BD
| Today | See what it's worth now |
| 29 Jul 2025 | £181,000 |
| 3 Feb 2010 | £162,500 |
42, Southburn Road, Blanefield G63 9DB
| Today | See what it's worth now |
| 4 Jul 2025 | £410,000 |
No other historical records.
15, Dumbrock Crescent, Strathblane G63 9DL

| Today | See what it's worth now |
| 24 Jun 2025 | £150,000 |
No other historical records.
10, Kirkburn Road, Glasgow G63 9DJ

| Today | See what it's worth now |
| 5 Jun 2025 | £245,000 |
| 27 Mar 2019 | £128,150 |
No other historical records.
Burn Cottage, Blanefield G63 9AX
| Today | See what it's worth now |
| 4 Jun 2025 | £625,000 |
| 19 Oct 2007 | £375,000 |
No other historical records.
12, Dumbrock Drive, Glasgow G63 9DN
| Today | See what it's worth now |
| 3 Jun 2025 | £237,500 |
| 31 May 2006 | £144,360 |
No other historical records.
Block 2 - 1, Station Lofts, Strathblane G63 9BD
| Today | See what it's worth now |
| 26 May 2025 | £175,000 |
| 27 Jul 2004 | £160,000 |
12, Southburn Road, Glasgow G63 9DB
| Today | See what it's worth now |
| 2 May 2025 | £300,150 |
| 8 Jun 2017 | £238,000 |
5, Blane Crescent, Blanefield G63 9HT

| Today | See what it's worth now |
| 30 Apr 2025 | £287,500 |
No other historical records.
16, Campsie Dene Road, Blanefield G63 9BN

| Today | See what it's worth now |
| 28 Apr 2025 | £620,000 |
No other historical records.
Corrieknowe Meadow, Campsie Dene Road, Blanefield G63 9BW

| Today | See what it's worth now |
| 25 Apr 2025 | £1,100,000 |
No other historical records.
17, Kirkhouse Road, Blanefield G63 9BX
| Today | See what it's worth now |
| 7 Apr 2025 | £455,000 |
No other historical records.
Source Acknowledgement: © Crown copyright. Scottish house price data is publicly available information produced by the Registers of Scotland. Material has been reproduced with the permission of the Keeper of the Registers of Scotland and contains data compiled by Registers of Scotland. For further information, please contact data@ros.gov.uk. Please note the dates shown here relate to the property's registered date not sold date.This material was last updated on 4 February 2026. It covers the period from 8 December 1987 to 31 December 2025 and contains property transactions which have been registered during that period.
Disclaimer: Rightmove.co.uk provides this Registers of Scotland data "as is". The burden for fitness of the data relies completely with the user and is provided for informational purposes only. No warranty, express or implied, is given relating to the accuracy of content of the Registers of Scotland data and Rightmove plc does not accept any liability for error or omission. If you have found an error with the data or need further information please contact data@ros.gov.uk
Permitted Use: The Registers of Scotland allows the reproduction of the data which it provides to Rightmove.co.uk free of charge in any format or medium only for research, private study or for internal circulation within an organisation. This is subject to it being reproduced accurately and not used in a misleading context. The material must be acknowledged as Crown Copyright. You are not allowed to use this information for commercial purposes, nor must you copy, distribute, sell or publish the data in any way. For any other use of this material, please apply to the Registers of Scotland for a licence. You can do this online at www.ros.gov.uk, by email at data@ros.gov.uk or by writing to Business Development, Registers of Scotland, Meadowbank House, 153 London Road, Edinburgh EH8 7AU.
Map data ©OpenStreetMap contributors.
Rightmove takes no liability for your use of, or reliance on, Rightmove's Instant Valuation due to the limitations of our tracking tool listed here. Use of this tool is taken entirely at your own risk. All rights reserved.