
House Prices in Bodmiscombe
House prices in Bodmiscombe have an overall average of £379,916 over the last year.
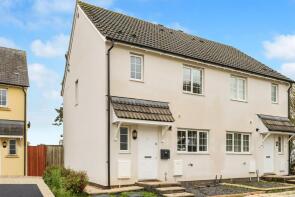
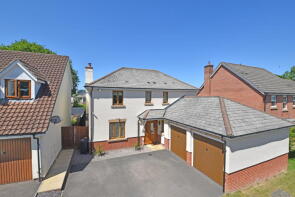
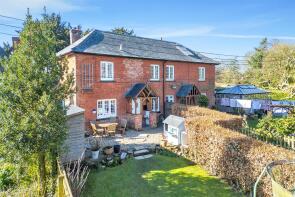
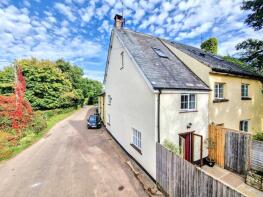
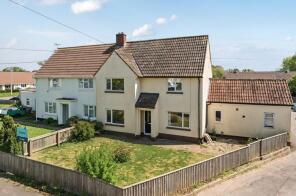
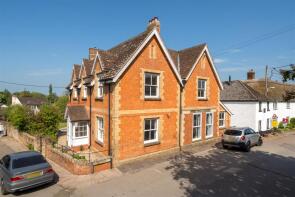
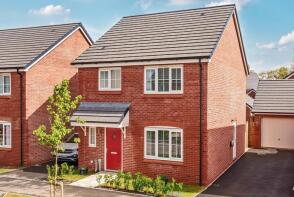
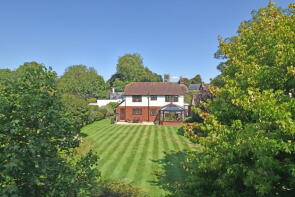
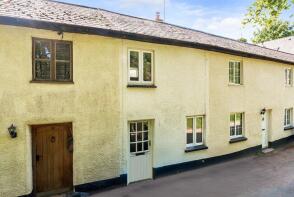
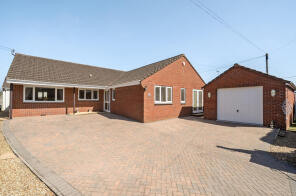
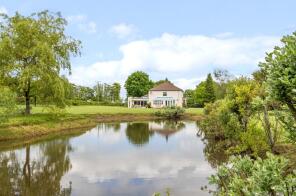
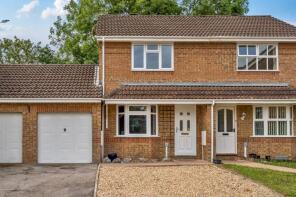
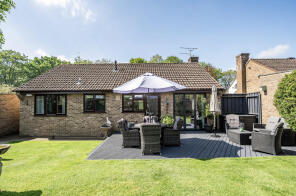
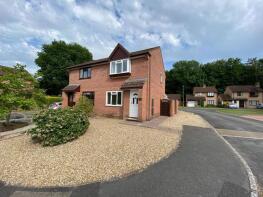
The majority of properties sold in Bodmiscombe during the last year were detached properties, selling for an average price of £487,382. Semi-detached properties sold for an average of £267,996, with terraced properties fetching £272,188.
Overall, the historical sold prices in Bodmiscombe over the last year were 4% up on the previous year and 14% down on the 2022 peak of £444,335.
Properties Sold
12, Greenwood, Cullompton EX15 2SY
| Today | See what it's worth now |
| 11 Mar 2026 | £250,000 |
| 27 Apr 2018 | £209,950 |
7, Harebell Drive, Cullompton EX15 2TZ
| Today | See what it's worth now |
| 25 Feb 2026 | £492,500 |
| 25 Nov 2016 | £300,000 |
Las Flores, Uffculme Road, Cullompton EX15 2SA
| Today | See what it's worth now |
| 25 Feb 2026 | £535,000 |
| 21 Feb 2018 | £395,000 |
No other historical records.
5, Market Place, Cullompton EX15 2RZ
| Today | See what it's worth now |
| 30 Jan 2026 | £185,000 |
| 9 Mar 2006 | £140,000 |
Flat 9, Granville Place, Station Road, Cullompton EX15 2PR

| Today | See what it's worth now |
| 30 Jan 2026 | £110,000 |
| 30 Mar 2016 | £92,500 |
2, Farthings Rise, Plymtree EX15 2JX

| Today | See what it's worth now |
| 26 Jan 2026 | £690,000 |
No other historical records.
2, Church Cottages, Lane From Clyst Hydon Primary School To Twynhayes Farm, Cullompton EX15 2ND
| Today | See what it's worth now |
| 12 Jan 2026 | £385,000 |
| 4 Apr 2014 | £247,500 |
5, Pencepool Cottages, Road From Normans Green House To Church, Cullompton EX15 2JY
| Today | See what it's worth now |
| 8 Jan 2026 | £260,000 |
| 5 Sep 2014 | £169,000 |
25, Somerlea, Cullompton EX15 2PY
| Today | See what it's worth now |
| 5 Jan 2026 | £254,000 |
| 20 Mar 2008 | £162,000 |
Old School House, Fore Street, Cullompton EX15 2AA
| Today | See what it's worth now |
| 16 Dec 2025 | £620,000 |
| 9 Jan 1998 | £110,000 |
No other historical records.
5, Blenheim Court, Cullompton EX15 2TE
| Today | See what it's worth now |
| 12 Dec 2025 | £430,000 |
| 6 May 2016 | £300,000 |
No other historical records.
35, Beech Close, Cullompton EX15 2SD
| Today | See what it's worth now |
| 12 Dec 2025 | £245,000 |
| 26 May 2017 | £175,000 |
15, Blenheim Drive, Cullompton EX15 2TB
| Today | See what it's worth now |
| 28 Nov 2025 | £342,000 |
| 17 Nov 2015 | £239,000 |
11, Foxglove Chase, Cullompton EX15 2TR
| Today | See what it's worth now |
| 25 Nov 2025 | £300,000 |
| 31 Jul 2014 | £217,500 |
17, Partridge Road, Willand EX15 2FR
| Today | See what it's worth now |
| 14 Nov 2025 | £325,000 |
| 1 Aug 2024 | £322,995 |
No other historical records.
Meadowlands, Green End Lane, Cullompton EX15 2JR
| Today | See what it's worth now |
| 12 Nov 2025 | £600,000 |
| 17 May 2001 | £215,000 |
No other historical records.
Wildwood, Road From Silver Street To Dean Hill Road, Cullompton EX15 2FJ
| Today | See what it's worth now |
| 12 Nov 2025 | £430,000 |
| 28 Apr 2022 | £425,000 |
No other historical records.
2, Pencepool Cottages, Plymtree EX15 2JY
| Today | See what it's worth now |
| 22 Oct 2025 | £148,000 |
No other historical records.
Springfield Lodge, Access Lane To Springfield Lodge, Normans Green, Cullompton EX15 2LA
| Today | See what it's worth now |
| 13 Oct 2025 | £515,000 |
| 12 Jan 2022 | £565,000 |
No other historical records.
Karma, Gables Road, Cullompton EX15 2PL
| Today | See what it's worth now |
| 8 Oct 2025 | £492,500 |
| 21 Nov 2008 | £250,000 |
No other historical records.
Woodcott, Broad Road, Kentisbeare EX15 2DU
| Today | See what it's worth now |
| 2 Oct 2025 | £1,350,000 |
| 22 Sep 2006 | £688,300 |
No other historical records.
8, Mulberry Close, Cullompton EX15 2PA
| Today | See what it's worth now |
| 1 Oct 2025 | £240,000 |
| 5 Dec 2012 | £147,500 |
3, Maple Close, Cullompton EX15 2SP
| Today | See what it's worth now |
| 30 Sep 2025 | £320,000 |
| 20 May 2016 | £205,000 |
No other historical records.
21, Sycamore Close, Willand EX15 2SH
| Today | See what it's worth now |
| 26 Sep 2025 | £222,000 |
No other historical records.
4, Parsons Close, Kentisbeare EX15 2BN
| Today | See what it's worth now |
| 26 Sep 2025 | £275,000 |
No other historical records.
Source Acknowledgement: © Crown copyright. England and Wales house price data is publicly available information produced by the HM Land Registry.This material was last updated on 15 May 2026. It covers the period from 1 January 1995 to 31 March 2026 and contains property transactions which have been registered during that period. Contains HM Land Registry data © Crown copyright and database right 2026. This data is licensed under the Open Government Licence v3.0.
Disclaimer: Rightmove.co.uk provides this HM Land Registry data "as is". The burden for fitness of the data relies completely with the user and is provided for informational purposes only. No warranty, express or implied, is given relating to the accuracy of content of the HM Land Registry data and Rightmove does not accept any liability for error or omission. If you have found an error with the data or need further information please contact HM Land Registry.
Permitted Use: Viewers of this Information are granted permission to access this Crown copyright material and to download it onto electronic, magnetic, optical or similar storage media provided that such activities are for private research, study or in-house use only. Any other use of the material requires the formal written permission of Land Registry which can be requested from us, and is subject to an additional licence and associated charge.
Map data ©OpenStreetMap contributors.
Rightmove takes no liability for your use of, or reliance on, Rightmove's Instant Valuation due to the limitations of our tracking tool listed here. Use of this tool is taken entirely at your own risk. All rights reserved.