
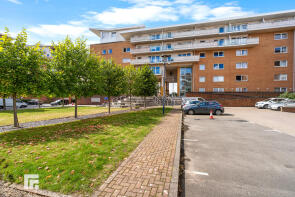
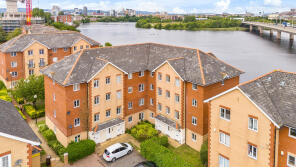
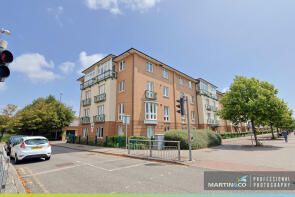
House Prices in Cardiff Bay
House prices in Cardiff Bay have an overall average of £196,437 over the last year.
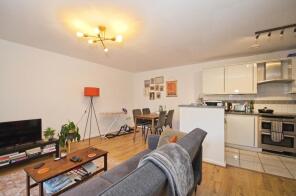
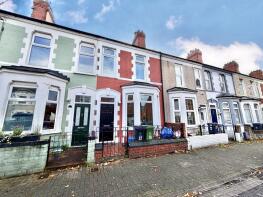
The majority of properties sold in Cardiff Bay during the last year were flats, selling for an average price of £176,198. Terraced properties sold for an average of £296,315, with semi-detached properties fetching £260,867.
Overall, the historical sold prices in Cardiff Bay over the last year were 1% up on the previous year and 5% down on the 2023 peak of £205,974.
Properties Sold
37, Hansen Court, Heol Glan Rheidol, Butetown, Cardiff CF10 5NX
| Today | See what it's worth now |
| 23 Apr 2026 | £150,000 |
| 15 May 2008 | £150,000 |
No other historical records.
130, Henke Court, Butetown, Cardiff CF10 4EJ

| Today | See what it's worth now |
| 8 Apr 2026 | £215,000 |
| 8 Sep 2021 | £175,000 |
6, Edward England Wharf, Lloyd George Avenue, Butetown, Cardiff CF10 4QL
| Today | See what it's worth now |
| 2 Apr 2026 | £148,600 |
| 3 Mar 2022 | £160,000 |
35, Moorby Court, Craiglee Drive, Butetown, Cardiff CF10 4BT
| Today | See what it's worth now |
| 2 Apr 2026 | £208,000 |
| 28 Apr 2004 | £125,000 |
25, Pomeroy Street, Butetown, Cardiff CF10 5GS
| Today | See what it's worth now |
| 1 Apr 2026 | £275,000 |
| 2 Feb 2018 | £200,000 |
No other historical records.
142, Campbell Drive, Grangetown, Cardiff CF11 7TQ
| Today | See what it's worth now |
| 27 Mar 2026 | £270,000 |
| 26 Feb 2021 | £205,000 |
No other historical records.
153, Penstone Court, Chandlery Way, Butetown, Cardiff CF10 5NP
| Today | See what it's worth now |
| 27 Mar 2026 | £183,500 |
| 1 Mar 2022 | £171,000 |
5, Ffordd James Mcghan, Grangetown, Cardiff CF11 7JT
| Today | See what it's worth now |
| 27 Mar 2026 | £155,000 |
| 25 May 2018 | £137,500 |
No other historical records.
62, Caldey Island House, Ferry Court, Grangetown, Cardiff CF11 0JN

| Today | See what it's worth now |
| 26 Mar 2026 | £185,000 |
| 19 Jul 2013 | £145,500 |
8, Overstone Court, Butetown, Cardiff CF10 5NT

| Today | See what it's worth now |
| 20 Mar 2026 | £162,500 |
| 23 Jan 2017 | £133,000 |
229, Penstone Court, Chandlery Way, Butetown, Cardiff CF10 5NQ

| Today | See what it's worth now |
| 20 Mar 2026 | £147,500 |
| 10 Feb 2006 | £140,000 |
No other historical records.
184, Adventurers Quay, Butetown, Cardiff CF10 4NS
| Today | See what it's worth now |
| 20 Mar 2026 | £200,000 |
| 18 Jan 2019 | £183,000 |
3, Roma House, Vellacott Close, Butetown, Cardiff CF10 4AQ
| Today | See what it's worth now |
| 20 Mar 2026 | £158,000 |
| 10 Jun 2022 | £144,000 |
22, Dan Donovan Way, Grangetown, Cardiff CF11 0JZ

| Today | See what it's worth now |
| 19 Mar 2026 | £720,000 |
| 30 Mar 2016 | £638,000 |
No other historical records.
31, Amity Court, Longueil Close, Butetown, Cardiff CF10 4EA
| Today | See what it's worth now |
| 18 Mar 2026 | £200,000 |
| 13 Jul 2001 | £112,000 |
No other historical records.
78, Seager Drive, Grangetown, Cardiff CF11 7EX

| Today | See what it's worth now |
| 18 Mar 2026 | £150,000 |
| 27 Nov 2020 | £130,000 |
11, Campbell Drive, Grangetown, Cardiff CF11 7QE
| Today | See what it's worth now |
| 16 Mar 2026 | £144,000 |
| 29 Mar 2019 | £115,000 |
6, Ocean House, Clarence Road, Butetown, Cardiff CF10 5FR

| Today | See what it's worth now |
| 16 Mar 2026 | £407,500 |
| 28 Mar 2014 | £290,000 |
8, Ocean House, Clarence Road, Butetown, Cardiff CF10 5FR

| Today | See what it's worth now |
| 16 Mar 2026 | £330,000 |
| 15 Dec 2017 | £260,000 |
778 Alexandria, Victoria Wharf, Watkiss Way, Grangetown, Cardiff CF11 0SF

| Today | See what it's worth now |
| 13 Mar 2026 | £130,000 |
| 13 Mar 2007 | £197,955 |
No other historical records.
94, Davaar House, Ferry Court, Grangetown, Cardiff CF11 0LB
| Today | See what it's worth now |
| 12 Mar 2026 | £158,000 |
| 20 Jun 2019 | £158,000 |
5, Claymore Place, Grangetown, Cardiff CF11 7JJ
| Today | See what it's worth now |
| 12 Mar 2026 | £219,500 |
| 19 Sep 2001 | £95,950 |
42, Seager Drive, Grangetown, Cardiff CF11 7QA

| Today | See what it's worth now |
| 9 Mar 2026 | £305,000 |
| 28 Feb 2022 | £290,000 |

Source Acknowledgement: © Crown copyright. England and Wales house price data is publicly available information produced by the HM Land Registry.This material was last updated on 9 July 2026. It covers the period from 1 January 1995 to 30 April 2026 and contains property transactions which have been registered during that period. Contains HM Land Registry data © Crown copyright and database right 2026. This data is licensed under the Open Government Licence v3.0.
Disclaimer: Rightmove.co.uk provides this HM Land Registry data "as is". The burden for fitness of the data relies completely with the user and is provided for informational purposes only. No warranty, express or implied, is given relating to the accuracy of content of the HM Land Registry data and Rightmove does not accept any liability for error or omission. If you have found an error with the data or need further information please contact HM Land Registry.
Permitted Use: Viewers of this Information are granted permission to access this Crown copyright material and to download it onto electronic, magnetic, optical or similar storage media provided that such activities are for private research, study or in-house use only. Any other use of the material requires the formal written permission of Land Registry which can be requested from us, and is subject to an additional licence and associated charge.
Rightmove takes no liability for your use of, or reliance on, Rightmove's Instant Valuation due to the limitations of our tracking tool listed here. Use of this tool is taken entirely at your own risk. All rights reserved.