
House Prices in Castle Hedingham
House prices in Castle Hedingham have an overall average of £356,864 over the last year.
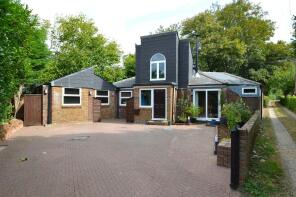
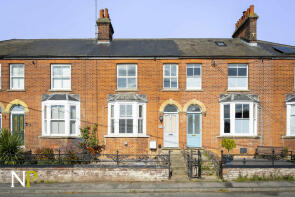
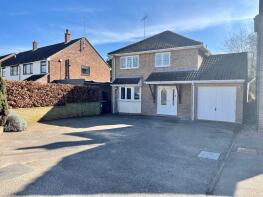
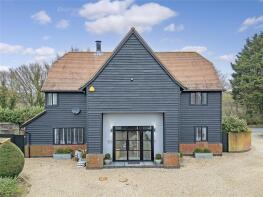
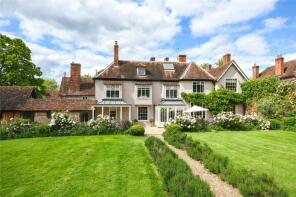
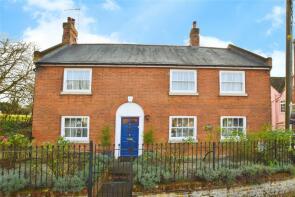
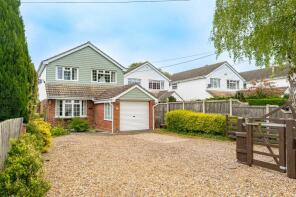
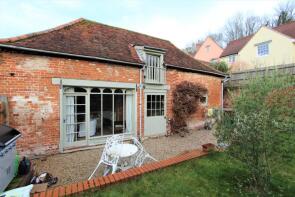
The majority of properties sold in Castle Hedingham during the last year were terraced properties, selling for an average price of £234,625. Detached properties sold for an average of £570,000, with semi-detached properties fetching £357,333.
Overall, the historical sold prices in Castle Hedingham over the last year were 27% down on the previous year and 19% down on the 2023 peak of £438,125.
Properties Sold
Doulton Lodge, Pottery Lane, Halstead CO9 3EU
| Today | See what it's worth now |
| 19 Jan 2026 | £525,000 |
| 7 Feb 2020 | £410,000 |
No other historical records.
30, Nunnery Street, Halstead CO9 3DW
| Today | See what it's worth now |
| 12 Dec 2025 | £290,000 |
| 23 Dec 2014 | £210,000 |
59, Nunnery Street, Halstead CO9 3DP
| Today | See what it's worth now |
| 4 Dec 2025 | £480,000 |
| 13 Oct 2005 | £325,000 |
West Barn, Coppingdown Farm, Sudbury Road, Castle Hedingham CO9 3AG
| Today | See what it's worth now |
| 28 Nov 2025 | £705,000 |
| 8 Dec 2023 | £635,000 |
7, St James Street, Halstead CO9 3EJ
| Today | See what it's worth now |
| 31 Oct 2025 | £183,500 |
| 6 Oct 2011 | £149,950 |
49, Bowmans Park, Castle Hedingham CO9 3DT
| Today | See what it's worth now |
| 10 Sep 2025 | £265,000 |
No other historical records.
6, Queen Street, Halstead CO9 3EX
| Today | See what it's worth now |
| 9 Sep 2025 | £345,000 |
| 1 Feb 2002 | £249,000 |
53, Nunnery Street, Castle Hedingham CO9 3DP
| Today | See what it's worth now |
| 27 Aug 2025 | £462,000 |
No other historical records.
22, Bowmans Park, Halstead CO9 3DT
| Today | See what it's worth now |
| 17 Jul 2025 | £205,000 |
| 16 Jun 2021 | £195,000 |
87, Nunnery Street, Halstead CO9 3DR
| Today | See what it's worth now |
| 11 Jul 2025 | £200,000 |
| 29 Mar 2005 | £130,000 |
No other historical records.
124, Nunnery Street, Halstead CO9 3DR

| Today | See what it's worth now |
| 10 Jul 2025 | £265,000 |
| 26 Jun 2020 | £238,000 |
70, Bowmans Park, Halstead CO9 3DT

| Today | See what it's worth now |
| 30 Jun 2025 | £295,000 |
| 5 Jan 2016 | £215,000 |
22, New Park, Halstead CO9 3HH
| Today | See what it's worth now |
| 2 Jun 2025 | £280,000 |
| 14 May 2018 | £245,000 |
No other historical records.
14, Bowmans Park, Castle Hedingham CO9 3DT
| Today | See what it's worth now |
| 30 May 2025 | £265,000 |
No other historical records.
23 Sheepcote, Queen Street, Halstead CO9 3HA
| Today | See what it's worth now |
| 31 Mar 2025 | £1,884,000 |
| 28 Feb 2003 | £786,000 |
No other historical records.
40, St James Street, Castle Hedingham CO9 3EW
| Today | See what it's worth now |
| 27 Mar 2025 | £862,500 |
No other historical records.
88, Nunnery Street, Halstead CO9 3DP
| Today | See what it's worth now |
| 14 Mar 2025 | £535,000 |
| 22 Jan 2015 | £381,000 |
No other historical records.
37, St James Street, Halstead CO9 3EW
| Today | See what it's worth now |
| 21 Feb 2025 | £775,000 |
| 16 Jan 2015 | £527,500 |
110a, Nunnery Street, Halstead CO9 3DP
| Today | See what it's worth now |
| 28 Jan 2025 | £580,000 |
| 30 Mar 2004 | £245,000 |
No other historical records.
3 Three Oaks, Priory Wood, Halstead CO9 3DU
| Today | See what it's worth now |
| 5 Dec 2024 | £650,000 |
| 24 Jul 2014 | £420,000 |
No other historical records.
18, St James Street, Halstead CO9 3EN

| Today | See what it's worth now |
| 27 Nov 2024 | £420,000 |
| 7 Jul 2021 | £335,000 |
30, New Park, Halstead CO9 3HH

| Today | See what it's worth now |
| 5 Nov 2024 | £315,000 |
| 17 Jul 2013 | £165,000 |
No other historical records.
2, Church Lane, Halstead CO9 3DA

| Today | See what it's worth now |
| 4 Nov 2024 | £290,000 |
| 31 Jan 2017 | £220,000 |
Source Acknowledgement: © Crown copyright. England and Wales house price data is publicly available information produced by the HM Land Registry.This material was last updated on 9 July 2026. It covers the period from 1 January 1995 to 30 April 2026 and contains property transactions which have been registered during that period. Contains HM Land Registry data © Crown copyright and database right 2026. This data is licensed under the Open Government Licence v3.0.
Disclaimer: Rightmove.co.uk provides this HM Land Registry data "as is". The burden for fitness of the data relies completely with the user and is provided for informational purposes only. No warranty, express or implied, is given relating to the accuracy of content of the HM Land Registry data and Rightmove does not accept any liability for error or omission. If you have found an error with the data or need further information please contact HM Land Registry.
Permitted Use: Viewers of this Information are granted permission to access this Crown copyright material and to download it onto electronic, magnetic, optical or similar storage media provided that such activities are for private research, study or in-house use only. Any other use of the material requires the formal written permission of Land Registry which can be requested from us, and is subject to an additional licence and associated charge.
Rightmove takes no liability for your use of, or reliance on, Rightmove's Instant Valuation due to the limitations of our tracking tool listed here. Use of this tool is taken entirely at your own risk. All rights reserved.