
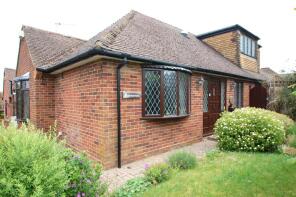
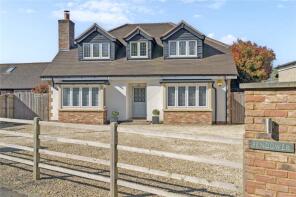
House Prices in Chalfont St. Giles
House prices in Chalfont St. Giles have an overall average of £930,124 over the last year.
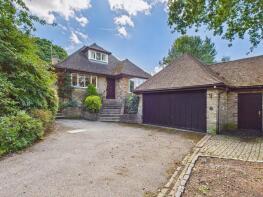
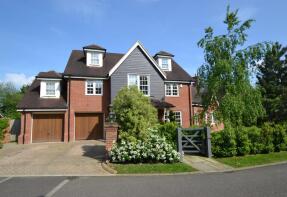
The majority of properties sold in Chalfont St. Giles during the last year were detached properties, selling for an average price of £1,177,916. Semi-detached properties sold for an average of £594,611, with terraced properties fetching £535,786.
Overall, the historical sold prices in Chalfont St. Giles over the last year were 2% down on the previous year and 26% down on the 2023 peak of £1,263,065.
Properties Sold
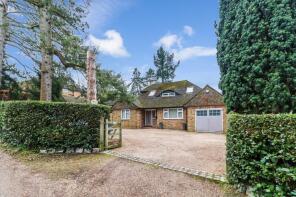
1, Lapraik Grove, Chalfont St. Giles HP8 4BX

| Today | See what it's worth now |
| 2 Apr 2026 | £346,500 |
| 12 Mar 2021 | £325,500 |
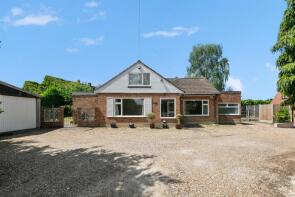
82, Bottrells Lane, Chalfont St. Giles HP8 4EH
| Today | See what it's worth now |
| 2 Apr 2026 | £641,550 |
| 27 Jun 2006 | £395,000 |
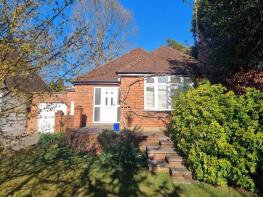
50, Kings Road, Chalfont St. Giles HP8 4HN
| Today | See what it's worth now |
| 26 Mar 2026 | £720,000 |
| 31 Oct 1997 | £176,000 |
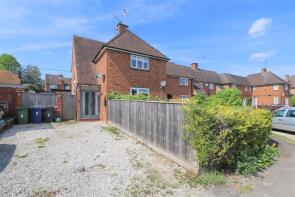
16, Palliser Road, Chalfont St. Giles HP8 4DN

| Today | See what it's worth now |
| 18 Mar 2026 | £530,000 |
| 11 May 1995 | £130,000 |
No other historical records.
38a, Deanway, Chalfont St Giles HP8 4JR
| Today | See what it's worth now |
| 11 Mar 2026 | £950,000 |
No other historical records.
47, Sycamore Road, Chalfont St. Giles HP8 4LG
| Today | See what it's worth now |
| 20 Feb 2026 | £535,000 |
| 24 Jan 2019 | £380,000 |
17, Tripps Hill Close, Chalfont St. Giles HP8 4JZ
| Today | See what it's worth now |
| 10 Feb 2026 | £723,500 |
| 18 Dec 2009 | £495,000 |
2, Ellwood Rise, Chalfont St. Giles HP8 4SU
| Today | See what it's worth now |
| 29 Jan 2026 | £1,147,500 |
| 8 May 1998 | £290,000 |
No other historical records.
61a, Sycamore Road, Chalfont St. Giles HP8 4LG

| Today | See what it's worth now |
| 27 Jan 2026 | £775,000 |
| 19 Apr 2021 | £447,500 |
No other historical records.
6, Highfield, Chalfont St Giles HP8 4HA
| Today | See what it's worth now |
| 27 Jan 2026 | £1,025,000 |
No other historical records.
Chinewood, Kings Close, Chalfont St Giles HP8 4HW
| Today | See what it's worth now |
| 21 Jan 2026 | £500,000 |
No other historical records.
9, Staceys Court, High Street, Chalfont St. Giles HP8 4QY

| Today | See what it's worth now |
| 16 Jan 2026 | £410,000 |
| 12 Dec 2013 | £245,000 |
6, Brayfield Lane, Chalfont St. Giles HP8 4FA
| Today | See what it's worth now |
| 16 Jan 2026 | £1,775,000 |
| 2 Dec 2016 | £1,525,000 |
No other historical records.
52 The Laurels, Milton Fields, Chalfont St. Giles HP8 4EP
| Today | See what it's worth now |
| 12 Jan 2026 | £1,025,000 |
| 15 Aug 2014 | £680,000 |
No other historical records.
Maythorn Cottage, Dodds Lane, Chalfont St. Giles HP8 4EL
| Today | See what it's worth now |
| 12 Jan 2026 | £1,425,000 |
| 26 May 1995 | £245,000 |
No other historical records.
58, Narcot Road, Chalfont St. Giles HP8 4DF
| Today | See what it's worth now |
| 15 Dec 2025 | £315,000 |
| 10 Mar 2022 | £338,000 |
6 Haslemere, Sycamore Close, Chalfont St. Giles HP8 4LF
| Today | See what it's worth now |
| 21 Nov 2025 | £725,000 |
| 28 Jun 2016 | £540,000 |
No other historical records.
Pine Crest, Park Grove, Little Chalfont HP8 4BG
| Today | See what it's worth now |
| 21 Nov 2025 | £1,560,000 |
No other historical records.
Tall Trees, Outlook Drive, Chalfont St Giles HP8 4NQ
| Today | See what it's worth now |
| 14 Nov 2025 | £1,170,000 |
No other historical records.
22 White Gable, The Lagger, Chalfont St. Giles HP8 4DG
| Today | See what it's worth now |
| 11 Nov 2025 | £695,000 |
| 29 Apr 1997 | £183,000 |
No other historical records.
Nova Scotia, London Road, Chalfont St. Giles HP8 4NH
| Today | See what it's worth now |
| 10 Nov 2025 | £620,000 |
| 12 Jan 2012 | £445,000 |
8, Middle Meadow, Chalfont St. Giles HP8 4QS
| Today | See what it's worth now |
| 30 Oct 2025 | £332,000 |
| 29 May 2020 | £308,000 |
17, Sycamore Road, Chalfont St. Giles HP8 4LE
| Today | See what it's worth now |
| 30 Oct 2025 | £610,000 |
| 18 Dec 2020 | £468,000 |

Source Acknowledgement: © Crown copyright. England and Wales house price data is publicly available information produced by the HM Land Registry.This material was last updated on 9 July 2026. It covers the period from 1 January 1995 to 30 April 2026 and contains property transactions which have been registered during that period. Contains HM Land Registry data © Crown copyright and database right 2026. This data is licensed under the Open Government Licence v3.0.
Disclaimer: Rightmove.co.uk provides this HM Land Registry data "as is". The burden for fitness of the data relies completely with the user and is provided for informational purposes only. No warranty, express or implied, is given relating to the accuracy of content of the HM Land Registry data and Rightmove does not accept any liability for error or omission. If you have found an error with the data or need further information please contact HM Land Registry.
Permitted Use: Viewers of this Information are granted permission to access this Crown copyright material and to download it onto electronic, magnetic, optical or similar storage media provided that such activities are for private research, study or in-house use only. Any other use of the material requires the formal written permission of Land Registry which can be requested from us, and is subject to an additional licence and associated charge.
Rightmove takes no liability for your use of, or reliance on, Rightmove's Instant Valuation due to the limitations of our tracking tool listed here. Use of this tool is taken entirely at your own risk. All rights reserved.