
House Prices in Chapelgate
House prices in Chapelgate have an overall average of £217,301 over the last year.
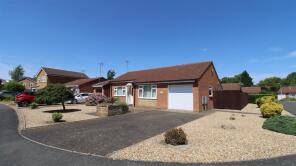
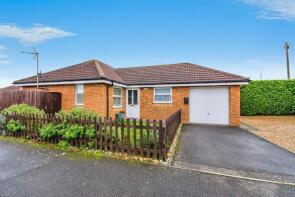
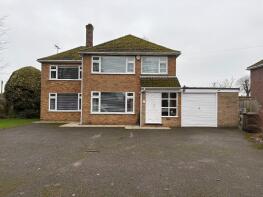
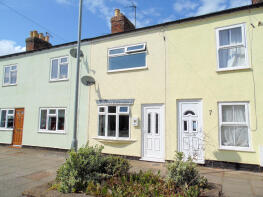
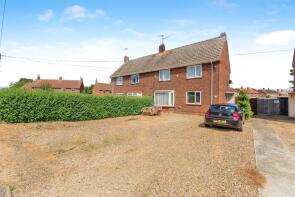
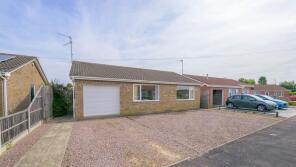
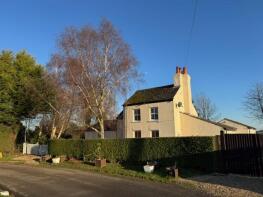
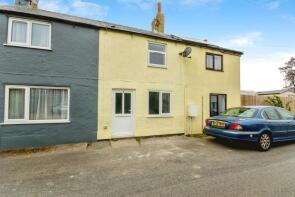
The majority of properties sold in Chapelgate during the last year were detached properties, selling for an average price of £288,988. Terraced properties sold for an average of £142,833, with semi-detached properties fetching £163,690.
Overall, the historical sold prices in Chapelgate over the last year were 4% down on the previous year and 7% down on the 2022 peak of £233,508.
Properties Sold
18, Stanley Drive, Sutton Bridge, Spalding PE12 9XQ
| Today | See what it's worth now |
| 16 Dec 2025 | £124,000 |
| 30 Oct 2001 | £39,000 |
No other historical records.
21, Withington Street, Sutton Bridge, Spalding PE12 9SU
| Today | See what it's worth now |
| 5 Dec 2025 | £112,500 |
| 10 Jan 2017 | £82,500 |
34a, Little London, Long Sutton, Spalding PE12 9LE


| Today | See what it's worth now |
| 2 Dec 2025 | £201,000 |
| 31 Jan 2019 | £157,000 |
221, Avenue Farm Road, Sutton Bridge, Spalding PE12 9QF

| Today | See what it's worth now |
| 1 Dec 2025 | £212,000 |
| 22 Dec 2016 | £134,000 |
27, Park Lane, Long Sutton, Spalding PE12 9DH
| Today | See what it's worth now |
| 28 Nov 2025 | £117,500 |
No other historical records.
26, Cowpers Gate, Long Sutton, Spalding PE12 9GG
| Today | See what it's worth now |
| 28 Nov 2025 | £298,000 |
| 16 May 2008 | £250,000 |
26, John Swains Way, Long Sutton, Spalding PE12 9DQ

| Today | See what it's worth now |
| 28 Nov 2025 | £250,000 |
| 10 May 2017 | £195,000 |
16, Windsor Gardens, Long Sutton, Spalding PE12 9DY

| Today | See what it's worth now |
| 28 Nov 2025 | £250,000 |
| 3 Jul 2024 | £240,000 |
28, Lowgate, Lutton, Spalding PE12 9HP
| Today | See what it's worth now |
| 27 Nov 2025 | £220,000 |
| 29 Aug 2014 | £152,000 |
Oakdene, Hospital Drove, Little Sutton, Spalding PE12 9EL
| Today | See what it's worth now |
| 21 Nov 2025 | £260,000 |
| 20 Jan 2016 | £190,000 |
No other historical records.
87, Bridge Road, Sutton Bridge, Spalding PE12 9SD
| Today | See what it's worth now |
| 17 Nov 2025 | £275,000 |
No other historical records.
Clarkville, Blackbarn Road, Gedney Drove End, Spalding PE12 0AY

| Today | See what it's worth now |
| 14 Nov 2025 | £230,000 |
| 14 Feb 2025 | £217,000 |
22, Woodlands, Long Sutton, Spalding PE12 9LY

| Today | See what it's worth now |
| 12 Nov 2025 | £205,000 |
| 11 Nov 2003 | £127,950 |
No other historical records.
34, Wrights Lane, Sutton Bridge, Spalding PE12 9RH
| Today | See what it's worth now |
| 7 Nov 2025 | £240,000 |
| 19 May 2017 | £157,000 |
No other historical records.
10, Church Green, Long Sutton, Spalding PE12 9BQ
| Today | See what it's worth now |
| 6 Nov 2025 | £260,000 |
| 30 Sep 2021 | £230,000 |
14 Rosebank, Mount Tumbledown Close, Sutton Bridge, Spalding PE12 9XN

| Today | See what it's worth now |
| 6 Nov 2025 | £183,000 |
| 19 Feb 2008 | £97,500 |
No other historical records.
2, Nightingale Way, Sutton Bridge, Spalding PE12 9RG
| Today | See what it's worth now |
| 30 Oct 2025 | £215,000 |
| 20 Feb 2019 | £183,000 |
53, Falklands Road, Sutton Bridge, Spalding PE12 9XF

| Today | See what it's worth now |
| 29 Oct 2025 | £285,000 |
| 28 Aug 2015 | £168,000 |
21, Park Road, Long Sutton, Spalding PE12 9DJ
| Today | See what it's worth now |
| 24 Oct 2025 | £355,000 |
| 28 Jan 1998 | £87,000 |
No other historical records.
21 Hannarane, Ropers Gate, Lutton, Spalding PE12 9NU

| Today | See what it's worth now |
| 23 Oct 2025 | £470,000 |
| 27 Apr 2018 | £175,000 |
6, Seagate Terrace, Long Sutton, Spalding PE12 9AA
| Today | See what it's worth now |
| 17 Oct 2025 | £128,000 |
| 23 Aug 2023 | £124,000 |
22, Allenbys Chase, Sutton Bridge, Spalding PE12 9SY
| Today | See what it's worth now |
| 15 Oct 2025 | £80,042 |
| 17 Apr 2015 | £106,000 |
24, Woodlands, Long Sutton, Spalding PE12 9LY
| Today | See what it's worth now |
| 8 Oct 2025 | £225,000 |
| 17 Feb 2012 | £137,000 |
Walnut Cottage, Roman Bank Crosses, Long Sutton, Spalding PE12 9AT
| Today | See what it's worth now |
| 8 Oct 2025 | £280,000 |
| 25 Apr 2008 | £278,000 |
No other historical records.
3, Pit Lane, Gedney Drove End, Spalding PE12 9PG
| Today | See what it's worth now |
| 30 Sep 2025 | £130,000 |
| 20 Dec 2018 | £96,500 |
Source Acknowledgement: © Crown copyright. England and Wales house price data is publicly available information produced by the HM Land Registry.This material was last updated on 4 February 2026. It covers the period from 1 January 1995 to 24 December 2025 and contains property transactions which have been registered during that period. Contains HM Land Registry data © Crown copyright and database right 2026. This data is licensed under the Open Government Licence v3.0.
Disclaimer: Rightmove.co.uk provides this HM Land Registry data "as is". The burden for fitness of the data relies completely with the user and is provided for informational purposes only. No warranty, express or implied, is given relating to the accuracy of content of the HM Land Registry data and Rightmove does not accept any liability for error or omission. If you have found an error with the data or need further information please contact HM Land Registry.
Permitted Use: Viewers of this Information are granted permission to access this Crown copyright material and to download it onto electronic, magnetic, optical or similar storage media provided that such activities are for private research, study or in-house use only. Any other use of the material requires the formal written permission of Land Registry which can be requested from us, and is subject to an additional licence and associated charge.
Map data ©OpenStreetMap contributors.
Rightmove takes no liability for your use of, or reliance on, Rightmove's Instant Valuation due to the limitations of our tracking tool listed here. Use of this tool is taken entirely at your own risk. All rights reserved.