
House Prices in Charing Station
House prices in Charing Station have an overall average of £526,361 over the last year.
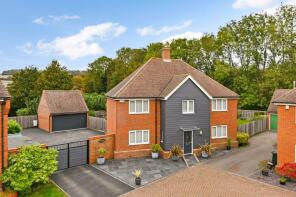
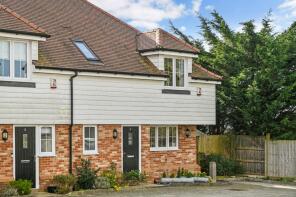
The majority of properties sold in Charing Station during the last year were detached properties, selling for an average price of £746,950. Terraced properties sold for an average of £241,250, with semi-detached properties fetching £310,000.
Overall, the historical sold prices in Charing Station over the last year were 10% up on the previous year and 26% down on the 2023 peak of £712,857.
Properties Sold
1, Eliza Cottages, Old Ashford Road, Ashford TN27 0JG
| Today | See what it's worth now |
| 12 Feb 2026 | £237,500 |
| 8 Jun 2015 | £167,500 |
No other historical records.
15a, Hither Field, Ashford TN27 0HZ
| Today | See what it's worth now |
| 19 Dec 2025 | £310,000 |
| 30 Aug 2019 | £242,000 |
3, Surgery Close, Ashford TN27 0AW


| Today | See what it's worth now |
| 31 Oct 2025 | £210,000 |
| 31 Mar 2010 | £124,999 |
16, Ellen Close, Ashford TN27 0GX

| Today | See what it's worth now |
| 21 Sep 2025 | £795,000 |
| 25 Sep 2019 | £725,000 |
9 The Firs, Station Road, Ashford TN27 0JA

| Today | See what it's worth now |
| 18 Sep 2025 | £1,155,000 |
| 28 Feb 2022 | £1,200,000 |
10, High Street, Ashford TN27 0HU
| Today | See what it's worth now |
| 29 Aug 2025 | £245,000 |
| 30 Apr 2019 | £185,000 |
No other historical records.
8, Ruglys Way, Ashford TN27 0GZ
| Today | See what it's worth now |
| 22 Aug 2025 | £740,000 |
| 30 Oct 2015 | £640,000 |
No other historical records.
7, Tatchell Drive, Ashford TN27 0GY
| Today | See what it's worth now |
| 21 Aug 2025 | £790,000 |
| 18 Oct 2004 | £425,000 |
No other historical records.
5 The Oak, High Street, Ashford TN27 0HU

| Today | See what it's worth now |
| 2 May 2025 | £254,750 |
No other historical records.
6, Blackberry Lane, Ashford TN27 0BQ
| Today | See what it's worth now |
| 17 Feb 2025 | £445,000 |
| 17 Aug 2018 | £399,995 |
No other historical records.
14, Tatchell Drive, Ashford TN27 0GY

| Today | See what it's worth now |
| 20 Dec 2024 | £570,000 |
| 23 Jul 2010 | £415,000 |
21, High Street, Ashford TN27 0HU
| Today | See what it's worth now |
| 21 Oct 2024 | £410,000 |
| 27 May 2020 | £360,000 |
The Corner House, High Street, Charing TN27 0HU

| Today | See what it's worth now |
| 25 Sep 2024 | £420,000 |
No other historical records.
The Grange, Ashford Road, Charing TN27 0JA
| Today | See what it's worth now |
| 30 Aug 2024 | £865,000 |
No other historical records.
34, Station Road, Ashford TN27 0JA
| Today | See what it's worth now |
| 29 Aug 2024 | £220,000 |
| 5 Apr 2002 | £106,500 |
Manton House, Burleigh Road, Ashford TN27 0JB
| Today | See what it's worth now |
| 28 Aug 2024 | £880,000 |
| 11 Feb 2011 | £630,000 |
24, Hither Field, Ashford TN27 0HZ
| Today | See what it's worth now |
| 17 Jul 2024 | £325,000 |
| 1 Nov 2013 | £180,000 |
35, Station Road, Ashford TN27 0JA

| Today | See what it's worth now |
| 4 Jul 2024 | £275,000 |
| 14 Aug 2015 | £198,000 |
Larkfield, Maidstone Road, Ashford TN27 0JD

| Today | See what it's worth now |
| 20 May 2024 | £480,000 |
No other historical records.
Peckwater Cottage, High Street, Charing TN27 0HU
| Today | See what it's worth now |
| 3 May 2024 | £370,000 |
No other historical records.
Cradwells, Pluckley Road, Ashford TN27 0AG

| Today | See what it's worth now |
| 20 Oct 2023 | £785,000 |
No other historical records.
8, Monks Walk, Ashford TN27 0HT

| Today | See what it's worth now |
| 29 Sep 2023 | £355,000 |
| 14 May 2021 | £340,000 |
1, Littledale, Ashford TN27 0AP

| Today | See what it's worth now |
| 10 Jul 2023 | £775,000 |
| 3 Oct 2016 | £599,995 |
No other historical records.
Tanners, Old Ashford Road, Ashford TN27 0JG

| Today | See what it's worth now |
| 16 Jun 2023 | £480,000 |
No other historical records.
10, Poppyfields, Ashford TN27 0AA

| Today | See what it's worth now |
| 31 May 2023 | £795,000 |
| 25 Nov 2016 | £679,995 |
No other historical records.
Source Acknowledgement: © Crown copyright. England and Wales house price data is publicly available information produced by the HM Land Registry.This material was last updated on 9 April 2026. It covers the period from 1 January 1995 to 27 February 2026 and contains property transactions which have been registered during that period. Contains HM Land Registry data © Crown copyright and database right 2026. This data is licensed under the Open Government Licence v3.0.
Disclaimer: Rightmove.co.uk provides this HM Land Registry data "as is". The burden for fitness of the data relies completely with the user and is provided for informational purposes only. No warranty, express or implied, is given relating to the accuracy of content of the HM Land Registry data and Rightmove does not accept any liability for error or omission. If you have found an error with the data or need further information please contact HM Land Registry.
Permitted Use: Viewers of this Information are granted permission to access this Crown copyright material and to download it onto electronic, magnetic, optical or similar storage media provided that such activities are for private research, study or in-house use only. Any other use of the material requires the formal written permission of Land Registry which can be requested from us, and is subject to an additional licence and associated charge.
Map data ©OpenStreetMap contributors.
Rightmove takes no liability for your use of, or reliance on, Rightmove's Instant Valuation due to the limitations of our tracking tool listed here. Use of this tool is taken entirely at your own risk. All rights reserved.