
House Prices in Cheneyhill
House prices in Cheneyhill have an overall average of £274,093 over the last year.
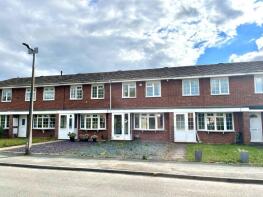
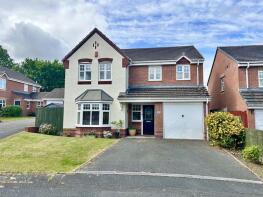
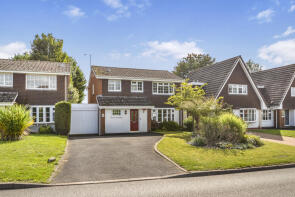
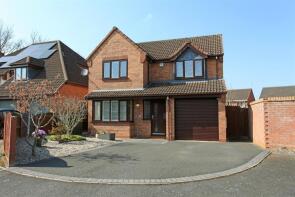
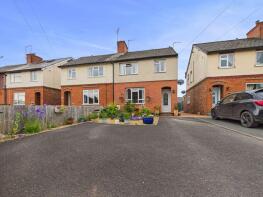
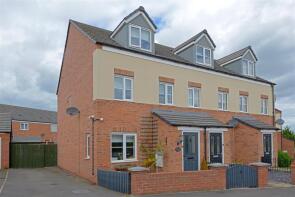
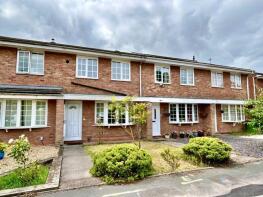
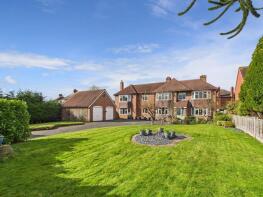
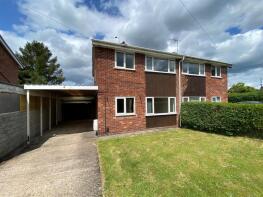
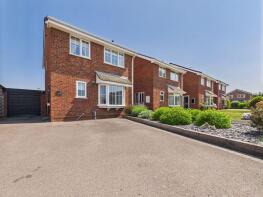
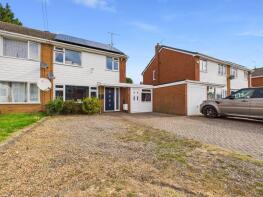
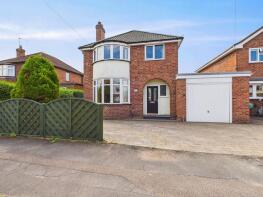
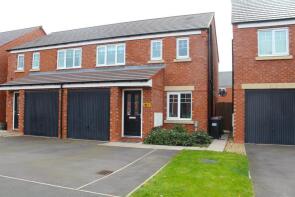
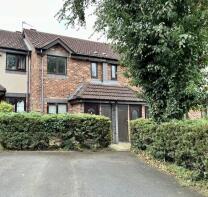
The majority of properties sold in Cheneyhill during the last year were detached properties, selling for an average price of £347,082. Semi-detached properties sold for an average of £257,592, with terraced properties fetching £219,971.
Overall, the historical sold prices in Cheneyhill over the last year were 8% up on the previous year and 7% up on the 2023 peak of £255,403.
Properties Sold
8, Broomfield Place, Newport TF10 7TS
| Today | See what it's worth now |
| 2 Feb 2026 | £185,000 |
| 18 Feb 2022 | £168,000 |
No other historical records.
17, Ben Jones Avenue, Newport TF10 7XY
| Today | See what it's worth now |
| 30 Jan 2026 | £415,000 |
| 14 Jan 2022 | £362,000 |
54, Forton Road, Newport TF10 8BT
| Today | See what it's worth now |
| 29 Jan 2026 | £372,500 |
| 19 Apr 2010 | £285,000 |
55, Daniels Cross, Newport TF10 7XJ
| Today | See what it's worth now |
| 23 Jan 2026 | £355,000 |
| 9 Jul 2020 | £277,000 |
12, Meadow View Close, Newport TF10 7NN
| Today | See what it's worth now |
| 23 Jan 2026 | £180,000 |
| 4 Aug 2015 | £119,000 |
37, Waterside Mews, Newport TF10 7PA
| Today | See what it's worth now |
| 23 Jan 2026 | £155,000 |
| 17 Dec 2015 | £104,000 |
53, Sandiford Crescent, Newport TF10 7QW
| Today | See what it's worth now |
| 23 Jan 2026 | £115,000 |
| 1 May 2019 | £73,000 |
No other historical records.
5, Fallow Deer Lawn, Newport TF10 7JF
| Today | See what it's worth now |
| 22 Jan 2026 | £385,000 |
| 15 Jun 2007 | £250,000 |
44, Ford Road, Newport TF10 7UH

| Today | See what it's worth now |
| 16 Jan 2026 | £362,500 |
| 7 Oct 2022 | £325,000 |
6, Meadow Road, Newport TF10 7TG
| Today | See what it's worth now |
| 16 Jan 2026 | £220,000 |
| 9 Apr 1998 | £35,000 |
No other historical records.
9, St George Way, Newport TF10 7FH
| Today | See what it's worth now |
| 13 Jan 2026 | £245,000 |
| 6 Mar 2017 | £179,950 |
No other historical records.
2, Station Terrace, Station Road, Newport TF10 7EX

| Today | See what it's worth now |
| 9 Jan 2026 | £110,000 |
| 3 Feb 2023 | £160,000 |
2, Broomfield Place, Newport TF10 7TS
| Today | See what it's worth now |
| 9 Jan 2026 | £180,000 |
| 6 Oct 2006 | £124,500 |
10, Adams Crescent, Newport TF10 7QJ
| Today | See what it's worth now |
| 22 Dec 2025 | £113,000 |
| 4 Oct 2017 | £95,000 |
23, Stafford Road, Newport TF10 7LZ
| Today | See what it's worth now |
| 12 Dec 2025 | £564,200 |
| 11 Aug 1995 | £102,500 |
No other historical records.
4, Greenacres Way, Newport TF10 7PQ
| Today | See what it's worth now |
| 11 Dec 2025 | £200,000 |
| 16 Jan 2015 | £149,000 |
No other historical records.
63, Boughey Road, Newport TF10 7RX
| Today | See what it's worth now |
| 10 Dec 2025 | £278,000 |
| 15 Nov 2002 | £115,000 |
No other historical records.
15, Meadow View Road, Newport TF10 7NL
| Today | See what it's worth now |
| 10 Dec 2025 | £250,000 |
| 10 Apr 2024 | £215,000 |
3, Audley Avenue, Newport TF10 7DP
| Today | See what it's worth now |
| 5 Dec 2025 | £345,000 |
| 14 Mar 2022 | £270,000 |
4, Mere Close, Newport TF10 7SL


| Today | See what it's worth now |
| 5 Dec 2025 | £310,000 |
| 19 May 2006 | £195,000 |
23, Churchill Close, Newport TF10 7GY
| Today | See what it's worth now |
| 3 Dec 2025 | £235,000 |
| 13 Mar 2020 | £204,950 |
No other historical records.
46, Waterside Mews, Newport TF10 7PA
| Today | See what it's worth now |
| 2 Dec 2025 | £150,000 |
| 16 Mar 2001 | £55,500 |
40, Vineyard Road, Newport TF10 7DA
| Today | See what it's worth now |
| 24 Nov 2025 | £199,950 |
| 28 Jan 2022 | £185,000 |
No other historical records.
2, Churchill Close, Newport TF10 7GX

| Today | See what it's worth now |
| 17 Nov 2025 | £315,000 |
| 26 Sep 2022 | £300,000 |
2, Ellesmere Court, Newport TF10 7SD
| Today | See what it's worth now |
| 5 Nov 2025 | £305,000 |
| 31 Jul 2015 | £214,000 |
Source Acknowledgement: © Crown copyright. England and Wales house price data is publicly available information produced by the HM Land Registry.This material was last updated on 9 April 2026. It covers the period from 1 January 1995 to 27 February 2026 and contains property transactions which have been registered during that period. Contains HM Land Registry data © Crown copyright and database right 2026. This data is licensed under the Open Government Licence v3.0.
Disclaimer: Rightmove.co.uk provides this HM Land Registry data "as is". The burden for fitness of the data relies completely with the user and is provided for informational purposes only. No warranty, express or implied, is given relating to the accuracy of content of the HM Land Registry data and Rightmove does not accept any liability for error or omission. If you have found an error with the data or need further information please contact HM Land Registry.
Permitted Use: Viewers of this Information are granted permission to access this Crown copyright material and to download it onto electronic, magnetic, optical or similar storage media provided that such activities are for private research, study or in-house use only. Any other use of the material requires the formal written permission of Land Registry which can be requested from us, and is subject to an additional licence and associated charge.
Map data ©OpenStreetMap contributors.
Rightmove takes no liability for your use of, or reliance on, Rightmove's Instant Valuation due to the limitations of our tracking tool listed here. Use of this tool is taken entirely at your own risk. All rights reserved.