
House Prices in Clay Cross
House prices in Clay Cross have an overall average of £215,223 over the last year.
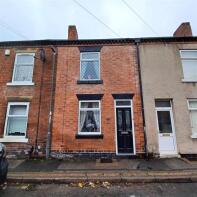
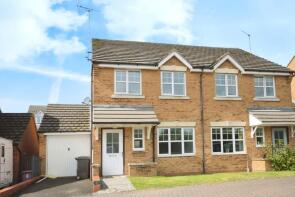
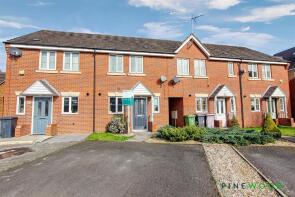
The majority of properties sold in Clay Cross during the last year were semi-detached properties, selling for an average price of £196,101. Detached properties sold for an average of £300,546, with terraced properties fetching £129,762.
Overall, the historical sold prices in Clay Cross over the last year were 5% down on the previous year and 7% down on the 2022 peak of £232,074.
Properties Sold
86, Clay Lane, Chesterfield S45 9AW

| Today | See what it's worth now |
| 27 Mar 2026 | £120,000 |
| 31 Jul 2019 | £86,500 |
23, Bertrand Avenue, Chesterfield S45 9JX
| Today | See what it's worth now |
| 25 Mar 2026 | £200,000 |
| 14 Jul 2017 | £158,000 |
No other historical records.
3, Stephenson Lane, Chesterfield S45 9FS
| Today | See what it's worth now |
| 20 Mar 2026 | £140,000 |
No other historical records.
16, Lime Walk, Chesterfield S45 9QA
| Today | See what it's worth now |
| 11 Mar 2026 | £220,000 |
| 29 Jul 2022 | £209,495 |
No other historical records.
51, Furnace Hill Road, Chesterfield S45 9TN
| Today | See what it's worth now |
| 9 Mar 2026 | £217,000 |
| 25 May 2017 | £150,000 |
3, The Fairways, Chesterfield S45 9BG
| Today | See what it's worth now |
| 6 Mar 2026 | £224,500 |
| 26 Aug 2022 | £210,000 |
26, Brassington Street, Clay Cross S45 9NH
| Today | See what it's worth now |
| 2 Mar 2026 | £105,000 |
No other historical records.
7, Birch Rise, Cemetery Road, Chesterfield S45 9DR
| Today | See what it's worth now |
| 27 Feb 2026 | £175,500 |
| 30 Nov 2021 | £155,000 |
12, Nethercroft Lane, Chesterfield S45 9DE
| Today | See what it's worth now |
| 23 Feb 2026 | £180,000 |
| 11 Aug 2023 | £185,000 |
18, Penncroft Lane, Chesterfield S45 9DN
| Today | See what it's worth now |
| 17 Feb 2026 | £134,000 |
| 27 Apr 2018 | £52,500 |
14, Wylam Close, Chesterfield S45 9TL
| Today | See what it's worth now |
| 17 Feb 2026 | £220,000 |
| 24 Feb 2023 | £189,950 |
84, Springvale Close, Chesterfield S45 9SA
| Today | See what it's worth now |
| 16 Feb 2026 | £190,000 |
| 14 Aug 2020 | £151,952 |
No other historical records.
16, Curbar Rise, Chesterfield S45 9UF
| Today | See what it's worth now |
| 13 Feb 2026 | £315,000 |
| 27 Apr 2023 | £294,995 |
No other historical records.
41, Hetton Drive, Chesterfield S45 9TG
| Today | See what it's worth now |
| 5 Feb 2026 | £167,000 |
| 29 Apr 2019 | £150,000 |
32, Florence Road, Chesterfield S45 9ND
| Today | See what it's worth now |
| 2 Feb 2026 | £170,000 |
| 24 Mar 2023 | £135,000 |
19, North Street, Chesterfield S45 9PJ
| Today | See what it's worth now |
| 26 Jan 2026 | £207,000 |
| 27 Apr 2018 | £124,950 |
109, Pilsley Road, Chesterfield S45 9BU
| Today | See what it's worth now |
| 23 Jan 2026 | £107,000 |
| 15 Oct 2020 | £90,000 |
13, Victoria Street, Chesterfield S45 9LF
| Today | See what it's worth now |
| 13 Jan 2026 | £120,000 |
| 15 Feb 2013 | £44,000 |
24a, Springvale Close, Chesterfield S45 9SA
| Today | See what it's worth now |
| 6 Jan 2026 | £180,000 |
| 10 Oct 2022 | £210,000 |
193, Thanet Street, Chesterfield S45 9JU
| Today | See what it's worth now |
| 3 Jan 2026 | £120,000 |
| 4 Aug 2021 | £93,000 |
9, Brassington Street, Chesterfield S45 9NH
| Today | See what it's worth now |
| 19 Dec 2025 | £128,000 |
| 21 Dec 2016 | £65,000 |
31, Brook Street, Chesterfield S45 9QZ
| Today | See what it's worth now |
| 19 Dec 2025 | £189,950 |
| 20 Mar 2018 | £130,000 |
16, Forge Lane, Clay Cross S45 9GN
| Today | See what it's worth now |
| 19 Dec 2025 | £375,246 |
No other historical records.

Source Acknowledgement: © Crown copyright. England and Wales house price data is publicly available information produced by the HM Land Registry.This material was last updated on 9 July 2026. It covers the period from 1 January 1995 to 30 April 2026 and contains property transactions which have been registered during that period. Contains HM Land Registry data © Crown copyright and database right 2026. This data is licensed under the Open Government Licence v3.0.
Disclaimer: Rightmove.co.uk provides this HM Land Registry data "as is". The burden for fitness of the data relies completely with the user and is provided for informational purposes only. No warranty, express or implied, is given relating to the accuracy of content of the HM Land Registry data and Rightmove does not accept any liability for error or omission. If you have found an error with the data or need further information please contact HM Land Registry.
Permitted Use: Viewers of this Information are granted permission to access this Crown copyright material and to download it onto electronic, magnetic, optical or similar storage media provided that such activities are for private research, study or in-house use only. Any other use of the material requires the formal written permission of Land Registry which can be requested from us, and is subject to an additional licence and associated charge.
Rightmove takes no liability for your use of, or reliance on, Rightmove's Instant Valuation due to the limitations of our tracking tool listed here. Use of this tool is taken entirely at your own risk. All rights reserved.