
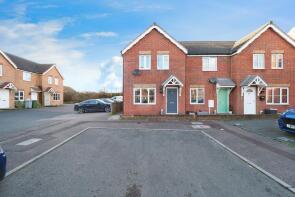
House Prices in Clipstone
House prices in Clipstone have an overall average of £233,767 over the last year.
The majority of properties sold in Clipstone during the last year were detached properties, selling for an average price of £299,643. Semi-detached properties sold for an average of £183,500, with terraced properties fetching £171,979.
Overall, the historical sold prices in Clipstone over the last year were 7% up on the previous year and 8% up on the 2022 peak of £216,972.
Properties Sold
12, Clay Cross Drive, Mansfield NG21 9FJ
| Today | See what it's worth now |
| 12 Dec 2025 | £165,000 |
| 3 Dec 2021 | £146,000 |
30, Waterfield Way, Mansfield NG21 9FD
| Today | See what it's worth now |
| 5 Dec 2025 | £370,000 |
| 24 Sep 2020 | £277,000 |
11, Dodsley Way, Mansfield NG21 9EZ
| Today | See what it's worth now |
| 5 Dec 2025 | £300,000 |
| 17 Jan 2011 | £187,000 |
15, First Oak Drive, Mansfield NG21 9FS

| Today | See what it's worth now |
| 28 Nov 2025 | £287,500 |
| 21 Nov 2013 | £212,995 |
No other historical records.
11, Blackthorn Gardens, Mansfield NG21 9HQ

| Today | See what it's worth now |
| 27 Nov 2025 | £330,000 |
| 27 Nov 2020 | £256,995 |
No other historical records.
99, Mansfield Road, Mansfield NG21 9AA
| Today | See what it's worth now |
| 7 Nov 2025 | £310,000 |
| 10 Jun 2020 | £208,000 |
21, Chaffinch Close, Mansfield NG21 9GT
| Today | See what it's worth now |
| 7 Nov 2025 | £235,000 |
| 21 Sep 2018 | £184,995 |
No other historical records.
87, Forest Road, Mansfield NG21 9DU
| Today | See what it's worth now |
| 31 Oct 2025 | £165,000 |
| 11 Feb 2022 | £95,000 |
No other historical records.
74, Bluebell Wood Lane, Mansfield NG21 9GB
| Today | See what it's worth now |
| 30 Oct 2025 | £175,000 |
| 17 Dec 2021 | £149,995 |
No other historical records.
48, First Oak Drive, Clipstone Village, Clipstone NG21 9FT


| Today | See what it's worth now |
| 24 Oct 2025 | £171,000 |
| 30 Nov 2020 | £134,000 |
6, Greendale Crescent, Mansfield NG21 9BD
| Today | See what it's worth now |
| 23 Oct 2025 | £121,000 |
| 4 Jul 2022 | £105,000 |
No other historical records.
15, Ward Road, Mansfield NG21 9FB
| Today | See what it's worth now |
| 21 Oct 2025 | £360,000 |
| 8 Aug 2003 | £169,600 |
No other historical records.
24, Emmerson Drive, Mansfield NG21 9AX
| Today | See what it's worth now |
| 10 Oct 2025 | £295,000 |
| 31 Jul 2009 | £161,000 |
No other historical records.
31, Sorrell Square, Mansfield NG21 9GX
| Today | See what it's worth now |
| 3 Oct 2025 | £230,000 |
| 31 Mar 2022 | £217,995 |
No other historical records.
64, Waterfield Way, Mansfield NG21 9FD
| Today | See what it's worth now |
| 3 Oct 2025 | £233,000 |
| 18 Dec 2020 | £219,995 |
No other historical records.
2, Osberne Way, Mansfield NG21 9RU
| Today | See what it's worth now |
| 26 Sep 2025 | £195,000 |
| 30 Aug 2019 | £125,000 |
37, Waterfield Way, Mansfield NG21 9FD
| Today | See what it's worth now |
| 25 Sep 2025 | £320,000 |
| 29 Oct 2021 | £299,995 |
No other historical records.
37, Bluebell Wood Lane, Mansfield NG21 9GB
| Today | See what it's worth now |
| 5 Sep 2025 | £270,000 |
| 20 Dec 2018 | £208,545 |
No other historical records.
38, Blackthorn Gardens, Mansfield NG21 9HQ
| Today | See what it's worth now |
| 5 Sep 2025 | £234,000 |
| 28 May 2021 | £184,995 |
No other historical records.
70, Waterfield Way, Mansfield NG21 9FD
| Today | See what it's worth now |
| 5 Sep 2025 | £315,000 |
| 4 Nov 2022 | £330,000 |
27, Dodsley Way, Mansfield NG21 9EZ
| Today | See what it's worth now |
| 5 Sep 2025 | £196,000 |
| 21 Dec 2012 | £115,000 |
No other historical records.
32, Waterfield Way, Mansfield NG21 9FD
| Today | See what it's worth now |
| 5 Sep 2025 | £370,000 |
| 30 Jun 2017 | £240,000 |
85, Emmerson Drive, Mansfield NG21 9AX
| Today | See what it's worth now |
| 28 Aug 2025 | £225,000 |
| 6 Jul 2021 | £175,000 |
25, Sorrell Square, Mansfield NG21 9GX

| Today | See what it's worth now |
| 22 Aug 2025 | £200,000 |
| 23 Oct 2020 | £164,995 |
No other historical records.
73, Waterfield Way, Mansfield NG21 9FD

| Today | See what it's worth now |
| 22 Aug 2025 | £210,000 |
| 28 May 2021 | £209,995 |
No other historical records.
Source Acknowledgement: © Crown copyright. England and Wales house price data is publicly available information produced by the HM Land Registry.This material was last updated on 4 February 2026. It covers the period from 1 January 1995 to 24 December 2025 and contains property transactions which have been registered during that period. Contains HM Land Registry data © Crown copyright and database right 2026. This data is licensed under the Open Government Licence v3.0.
Disclaimer: Rightmove.co.uk provides this HM Land Registry data "as is". The burden for fitness of the data relies completely with the user and is provided for informational purposes only. No warranty, express or implied, is given relating to the accuracy of content of the HM Land Registry data and Rightmove does not accept any liability for error or omission. If you have found an error with the data or need further information please contact HM Land Registry.
Permitted Use: Viewers of this Information are granted permission to access this Crown copyright material and to download it onto electronic, magnetic, optical or similar storage media provided that such activities are for private research, study or in-house use only. Any other use of the material requires the formal written permission of Land Registry which can be requested from us, and is subject to an additional licence and associated charge.
Map data ©OpenStreetMap contributors.
Rightmove takes no liability for your use of, or reliance on, Rightmove's Instant Valuation due to the limitations of our tracking tool listed here. Use of this tool is taken entirely at your own risk. All rights reserved.