
House Prices in Crewe
House prices in Crewe have an overall average of £218,228 over the last year.
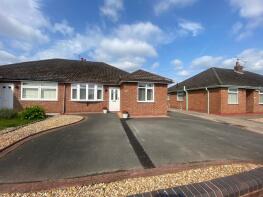
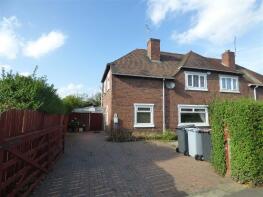
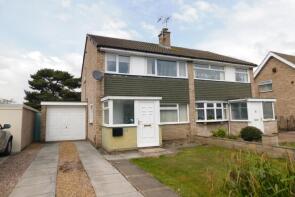
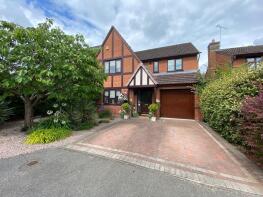
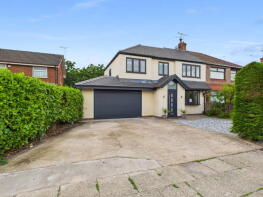
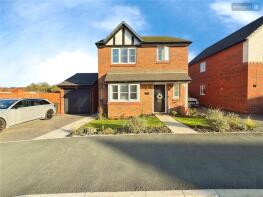
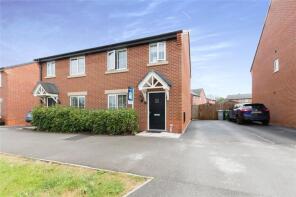
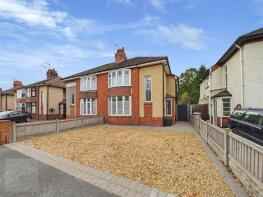
The majority of properties sold in Crewe during the last year were semi-detached properties, selling for an average price of £208,711. Detached properties sold for an average of £317,556, with terraced properties fetching £140,371.
Overall, the historical sold prices in Crewe over the last year were 7% up on the previous year and 6% up on the 2022 peak of £205,747.
Properties Sold
31, Kipling Way, Crewe CW1 5JG
| Today | See what it's worth now |
| 28 Apr 2026 | £230,000 |
| 12 Sep 2014 | £115,000 |
No other historical records.
92, Claughton Avenue, Crewe CW2 6EY
| Today | See what it's worth now |
| 17 Apr 2026 | £32,500 |
| 22 Jun 2018 | £105,000 |
36, Bowness Road, Crewe CW2 8RN
| Today | See what it's worth now |
| 17 Apr 2026 | £44,600 |
| 6 Jul 2022 | £180,000 |
25, Crewe Road, Crewe CW1 6DT
| Today | See what it's worth now |
| 16 Apr 2026 | £105,000 |
No other historical records.
15, Swallowfield Close, Crewe CW2 6XB
| Today | See what it's worth now |
| 14 Apr 2026 | £350,000 |
| 22 May 1998 | £90,000 |
35, Marley Avenue, Crewe CW1 3SN
| Today | See what it's worth now |
| 10 Apr 2026 | £210,000 |
| 14 Jun 2018 | £117,500 |
No other historical records.
2, Lyceum Close, Crewe CW1 3YB
| Today | See what it's worth now |
| 10 Apr 2026 | £230,000 |
| 16 Jul 2013 | £114,950 |
64, Higher Croft Drive, Crewe CW1 4FT

| Today | See what it's worth now |
| 10 Apr 2026 | £268,000 |
| 31 Mar 2020 | £214,995 |
No other historical records.
65, Coleridge Way, Crewe CW1 5JX
| Today | See what it's worth now |
| 9 Apr 2026 | £25,000 |
| 26 Jul 2021 | £152,500 |
No other historical records.
8, Carrington Way, Crewe CW1 3YE
| Today | See what it's worth now |
| 8 Apr 2026 | £238,000 |
| 24 Jan 2020 | £142,000 |
2, Brookland Avenue, Crewe CW2 8EJ
| Today | See what it's worth now |
| 7 Apr 2026 | £355,000 |
| 15 Jan 2008 | £210,000 |
No other historical records.
103, Rochester Crescent, Crewe CW1 5YQ

| Today | See what it's worth now |
| 7 Apr 2026 | £180,000 |
| 22 Jun 2015 | £112,000 |
15, Cubitt Close, Nantwich CW5 6SY
| Today | See what it's worth now |
| 2 Apr 2026 | £250,000 |
| 26 Jun 2020 | £226,950 |
No other historical records.
8, Fawcett Place, Crewe CW1 4UL
| Today | See what it's worth now |
| 31 Mar 2026 | £230,000 |
| 14 Sep 2020 | £199,995 |
No other historical records.
32, Manor Avenue, Crewe CW2 8BD
| Today | See what it's worth now |
| 30 Mar 2026 | £555,000 |
| 22 Feb 2013 | £234,000 |
No other historical records.
35, Lansdowne Road, Crewe CW1 5JZ
| Today | See what it's worth now |
| 27 Mar 2026 | £230,000 |
| 24 Aug 2018 | £150,000 |
52, Gainsborough Road, Crewe CW2 7PH
| Today | See what it's worth now |
| 27 Mar 2026 | £225,000 |
| 28 Sep 2021 | £187,500 |
22, Maw Green Road, Crewe CW1 4HH
| Today | See what it's worth now |
| 27 Mar 2026 | £340,000 |
| 15 Dec 2021 | £285,000 |
4, Ashbank Place, Crewe CW1 3FR
| Today | See what it's worth now |
| 27 Mar 2026 | £121,000 |
| 29 Jan 2008 | £159,000 |
No other historical records.
8, Patterdale Close, Crewe CW2 8NX
| Today | See what it's worth now |
| 27 Mar 2026 | £235,000 |
| 11 Jun 2004 | £153,000 |
No other historical records.
26, Coleridge Way, Crewe CW1 5JW
| Today | See what it's worth now |
| 27 Mar 2026 | £325,000 |
| 4 Nov 2011 | £100,000 |
63, Mablins Lane, Crewe CW1 3RF
| Today | See what it's worth now |
| 26 Mar 2026 | £300,000 |
| 16 Dec 2021 | £190,000 |
No other historical records.
19, Corbetts Close, Crewe CW2 8GN
| Today | See what it's worth now |
| 25 Mar 2026 | £290,000 |
| 28 Jun 2021 | £248,995 |
No other historical records.
Source Acknowledgement: © Crown copyright. England and Wales house price data is publicly available information produced by the HM Land Registry.This material was last updated on 9 July 2026. It covers the period from 1 January 1995 to 30 April 2026 and contains property transactions which have been registered during that period. Contains HM Land Registry data © Crown copyright and database right 2026. This data is licensed under the Open Government Licence v3.0.
Disclaimer: Rightmove.co.uk provides this HM Land Registry data "as is". The burden for fitness of the data relies completely with the user and is provided for informational purposes only. No warranty, express or implied, is given relating to the accuracy of content of the HM Land Registry data and Rightmove does not accept any liability for error or omission. If you have found an error with the data or need further information please contact HM Land Registry.
Permitted Use: Viewers of this Information are granted permission to access this Crown copyright material and to download it onto electronic, magnetic, optical or similar storage media provided that such activities are for private research, study or in-house use only. Any other use of the material requires the formal written permission of Land Registry which can be requested from us, and is subject to an additional licence and associated charge.
Rightmove takes no liability for your use of, or reliance on, Rightmove's Instant Valuation due to the limitations of our tracking tool listed here. Use of this tool is taken entirely at your own risk. All rights reserved.