
House Prices in Cross Hands
House prices in Cross Hands have an overall average of £216,121 over the last year.
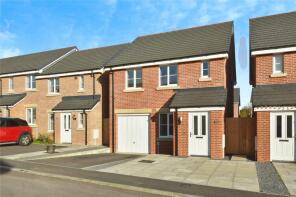
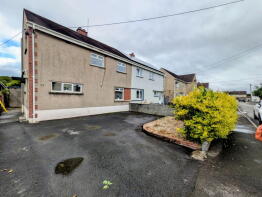
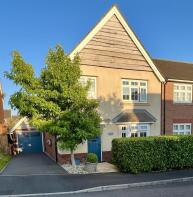
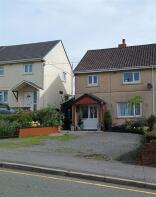
The majority of properties sold in Cross Hands during the last year were detached properties, selling for an average price of £257,066. Semi-detached properties sold for an average of £174,694, with terraced properties fetching £135,833.
Overall, the historical sold prices in Cross Hands over the last year were 1% up on the previous year and similar to the 2023 peak of £217,469.
Properties Sold
114, Heol Cae Pownd, Cefneithin, Llanelli SA14 7BZ
| Today | See what it's worth now |
| 1 Dec 2025 | £225,000 |
| 30 Jun 2023 | £249,995 |
No other historical records.
73, Caeglas, Cross Hands, Llanelli SA14 6NH
| Today | See what it's worth now |
| 28 Nov 2025 | £157,950 |
| 7 Feb 2006 | £85,500 |
No other historical records.
44, Clos Maes Rhedyn, Gorslas, Llanelli SA14 6SG
| Today | See what it's worth now |
| 21 Nov 2025 | £275,000 |
| 29 Jun 2012 | £165,000 |
No other historical records.
85, Carmarthen Road, Cross Hands, Llanelli SA14 6SU

| Today | See what it's worth now |
| 10 Nov 2025 | £175,000 |
| 2 Mar 2012 | £79,500 |
5, Heol Y Deri, Cwmgwili, Llanelli SA14 6PH
| Today | See what it's worth now |
| 4 Nov 2025 | £210,000 |
| 5 Aug 2022 | £195,000 |
Lyndhurst, Cross Hands Road, Gorslas, Llanelli SA14 6RH


| Today | See what it's worth now |
| 30 Oct 2025 | £240,000 |
No other historical records.
141, Carmarthen Road, Cross Hands, Llanelli SA14 6TD

| Today | See what it's worth now |
| 22 Oct 2025 | £170,000 |
| 12 Oct 2018 | £85,000 |
No other historical records.
64, Caeglas, Cross Hands, Llanelli SA14 6NH

| Today | See what it's worth now |
| 6 Oct 2025 | £142,500 |
| 21 Oct 2010 | £71,000 |
91, Heol Bryngwili, Cross Hands, Llanelli SA14 6LY
| Today | See what it's worth now |
| 24 Sep 2025 | £107,000 |
| 1 May 2002 | £51,500 |
No other historical records.
Glasfryn, Thornhill Road, Cwmgwili, Llanelli SA14 6PT
| Today | See what it's worth now |
| 23 Sep 2025 | £238,000 |
| 15 Jun 2016 | £152,500 |
Cwm Tawel, Pontardulais Road, Cross Hands, Llanelli SA14 6PG
| Today | See what it's worth now |
| 15 Aug 2025 | £302,000 |
| 25 Jun 2014 | £200,000 |
7, Heol Bryngwili, Cross Hands, Llanelli SA14 6LR
| Today | See what it's worth now |
| 15 Aug 2025 | £332,000 |
| 18 Sep 1997 | £73,000 |
No other historical records.
22a, Llandeilo Road, Cross Hands, Llanelli SA14 6NA

| Today | See what it's worth now |
| 11 Aug 2025 | £137,000 |
| 1 Mar 2024 | £120,000 |
62, Heol Cae Pownd, Cefneithin, Llanelli SA14 7BZ
| Today | See what it's worth now |
| 30 Jul 2025 | £225,000 |
| 21 Dec 2018 | £176,995 |
No other historical records.
65, Carmarthen Road, Cross Hands, Llanelli SA14 6SU

| Today | See what it's worth now |
| 11 Jul 2025 | £225,000 |
| 17 Nov 2020 | £155,000 |
25, Tir Y Dderwen, Cross Hands, Llanelli SA14 6SZ

| Today | See what it's worth now |
| 4 Jul 2025 | £234,950 |
| 26 Apr 2022 | £205,000 |
28, Heol Cae Pownd, Cefneithin, Llanelli SA14 7BZ

| Today | See what it's worth now |
| 11 Jun 2025 | £255,000 |
| 30 Aug 2019 | £184,995 |
No other historical records.
4, Clos Maes Rhedyn, Gorslas, Llanelli SA14 6SG
| Today | See what it's worth now |
| 19 May 2025 | £245,000 |
| 21 Oct 2016 | £156,500 |
140, Heol Bryngwili, Cross Hands, Llanelli SA14 6LY
| Today | See what it's worth now |
| 16 May 2025 | £280,610 |
| 29 Jan 2021 | £134,500 |
No other historical records.
4, Llys Nant Glas, Cross Hands, Llanelli SA14 6EX
| Today | See what it's worth now |
| 8 May 2025 | £330,000 |
| 18 Nov 2022 | £325,000 |
No other historical records.
23, Woodlands Terrace, Cross Hands, Llanelli SA14 6NS
| Today | See what it's worth now |
| 28 Apr 2025 | £128,000 |
| 30 Sep 2022 | £126,000 |
92, Heol Y Parc, Cefneithin, Llanelli SA14 7DS
| Today | See what it's worth now |
| 25 Apr 2025 | £300,000 |
| 26 Aug 2016 | £180,000 |
No other historical records.
76, Heol Bryngwili, Cross Hands, Llanelli SA14 6LU

| Today | See what it's worth now |
| 23 Apr 2025 | £258,000 |
No other historical records.
10, Coed Y Dderwen, Cwmgwili, Llanelli SA14 6DZ
| Today | See what it's worth now |
| 11 Apr 2025 | £220,000 |
| 28 Aug 2020 | £165,000 |
No other historical records.
54, Heol Bryngwili, Cross Hands, Llanelli SA14 6LR
| Today | See what it's worth now |
| 4 Apr 2025 | £135,000 |
No other historical records.
Source Acknowledgement: © Crown copyright. England and Wales house price data is publicly available information produced by the HM Land Registry.This material was last updated on 4 February 2026. It covers the period from 1 January 1995 to 24 December 2025 and contains property transactions which have been registered during that period. Contains HM Land Registry data © Crown copyright and database right 2026. This data is licensed under the Open Government Licence v3.0.
Disclaimer: Rightmove.co.uk provides this HM Land Registry data "as is". The burden for fitness of the data relies completely with the user and is provided for informational purposes only. No warranty, express or implied, is given relating to the accuracy of content of the HM Land Registry data and Rightmove does not accept any liability for error or omission. If you have found an error with the data or need further information please contact HM Land Registry.
Permitted Use: Viewers of this Information are granted permission to access this Crown copyright material and to download it onto electronic, magnetic, optical or similar storage media provided that such activities are for private research, study or in-house use only. Any other use of the material requires the formal written permission of Land Registry which can be requested from us, and is subject to an additional licence and associated charge.
Map data ©OpenStreetMap contributors.
Rightmove takes no liability for your use of, or reliance on, Rightmove's Instant Valuation due to the limitations of our tracking tool listed here. Use of this tool is taken entirely at your own risk. All rights reserved.