
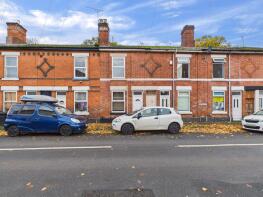
House Prices in DE1
House prices in DE1 have an overall average of £175,585 over the last year.
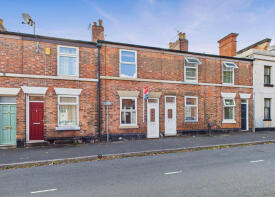
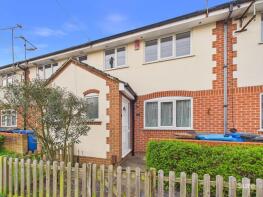
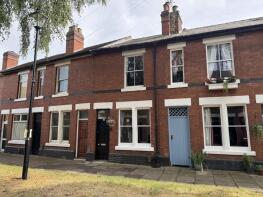
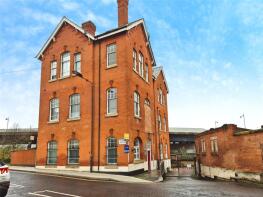
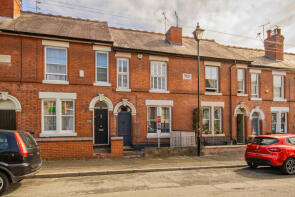
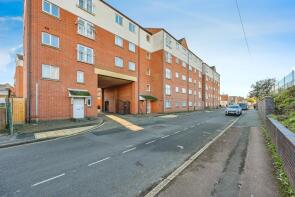
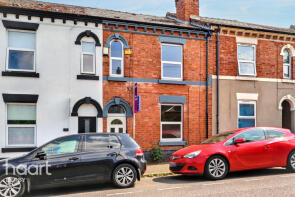
The majority of properties sold in DE1 during the last year were terraced properties, selling for an average price of £186,469. Flats sold for an average of £115,384, with semi-detached properties fetching £210,100.
Overall, the historical sold prices in DE1 over the last year were 3% down on the previous year and 3% down on the 2022 peak of £181,465.
Properties Sold
59, Otter Street, Derby DE1 3FD

| Today | See what it's worth now |
| 2 Apr 2026 | £95,000 |
| 22 Feb 2018 | £279,950 |
Flat 24, Cathedral View, Full Street, Derby DE1 3AF
| Today | See what it's worth now |
| 31 Mar 2026 | £116,000 |
| 18 Dec 2015 | £134,995 |
No other historical records.
15, Castleward Court, Trinity Walk, Derby DE1 2JY
| Today | See what it's worth now |
| 30 Mar 2026 | £160,000 |
| 25 Nov 2021 | £155,000 |
Extensions and planning permission in DE1
See planning approval stats, extension build costs and value added estimates.

29, Saxelbye Avenue, Derby DE1 2UH
| Today | See what it's worth now |
| 27 Mar 2026 | £247,000 |
| 30 Apr 2021 | £226,000 |
No other historical records.
25, Roman Road, Derby DE1 3RX
| Today | See what it's worth now |
| 20 Mar 2026 | £215,000 |
| 10 Dec 2012 | £154,000 |
137, City Road, Derby DE1 3RR
| Today | See what it's worth now |
| 20 Mar 2026 | £220,000 |
| 24 Mar 2016 | £165,000 |
129, Watson Street, Derby DE1 3PJ
| Today | See what it's worth now |
| 13 Mar 2026 | £145,000 |
No other historical records.
5, St Johns Terrace, Derby DE1 3LJ
| Today | See what it's worth now |
| 11 Mar 2026 | £352,000 |
| 29 Jan 1996 | £62,000 |
No other historical records.
25, Leyland Street, Derby DE1 3PP
| Today | See what it's worth now |
| 9 Mar 2026 | £170,000 |
| 21 Aug 2007 | £107,500 |
No other historical records.
Flat 41, Cathedral View, Full Street, Derby DE1 3AF

| Today | See what it's worth now |
| 6 Mar 2026 | £58,000 |
| 21 Dec 2015 | £112,995 |
No other historical records.
34, Walter Street, Derby DE1 3PR
| Today | See what it's worth now |
| 6 Mar 2026 | £182,000 |
| 20 Dec 2013 | £99,950 |
4, Ambrose Terrace, Derby DE1 1DQ
| Today | See what it's worth now |
| 4 Mar 2026 | £127,000 |
| 14 Jun 2013 | £98,000 |
16, Auriga Court, Derby DE1 3RH
| Today | See what it's worth now |
| 3 Mar 2026 | £202,000 |
| 15 Jun 2017 | £185,000 |
21, South Street, Derby DE1 1DS
| Today | See what it's worth now |
| 2 Mar 2026 | £150,000 |
| 4 May 2018 | £124,000 |
11, Markeaton Street, Derby DE1 1DX
| Today | See what it's worth now |
| 27 Feb 2026 | £195,000 |
| 15 Feb 2021 | £152,500 |
44, Camp Street, Derby DE1 3SD
| Today | See what it's worth now |
| 20 Feb 2026 | £202,000 |
| 9 Jun 2023 | £200,000 |
10, Weavers Point, Lodge Lane, Derby DE1 3HE

| Today | See what it's worth now |
| 20 Feb 2026 | £163,000 |
| 30 Aug 2016 | £151,000 |
No other historical records.
5, Amber House, Railway Terrace, Derby DE1 2RU
| Today | See what it's worth now |
| 19 Feb 2026 | £120,000 |
| 15 Jan 2019 | £114,000 |
No other historical records.
11, Roman Road, Derby DE1 3RX
| Today | See what it's worth now |
| 18 Feb 2026 | £140,000 |
| 25 Nov 2019 | £136,500 |
9, The School Yard, Edward Street, Derby DE1 3BL
| Today | See what it's worth now |
| 7 Feb 2026 | £157,500 |
| 13 Aug 2018 | £160,000 |
7, Mundy Street, Derby DE1 3PS
| Today | See what it's worth now |
| 30 Jan 2026 | £177,000 |
No other historical records.
62, Saxelbye Avenue, Derby DE1 2UH
| Today | See what it's worth now |
| 30 Jan 2026 | £210,000 |
| 20 Dec 2021 | £193,000 |
No other historical records.
108, Arthur Street, Derby DE1 3EH
| Today | See what it's worth now |
| 23 Jan 2026 | £275,000 |
| 12 Dec 2017 | £240,000 |
Source Acknowledgement: © Crown copyright. England and Wales house price data is publicly available information produced by the HM Land Registry.This material was last updated on 9 July 2026. It covers the period from 1 January 1995 to 30 April 2026 and contains property transactions which have been registered during that period. Contains HM Land Registry data © Crown copyright and database right 2026. This data is licensed under the Open Government Licence v3.0.
Disclaimer: Rightmove.co.uk provides this HM Land Registry data "as is". The burden for fitness of the data relies completely with the user and is provided for informational purposes only. No warranty, express or implied, is given relating to the accuracy of content of the HM Land Registry data and Rightmove does not accept any liability for error or omission. If you have found an error with the data or need further information please contact HM Land Registry.
Permitted Use: Viewers of this Information are granted permission to access this Crown copyright material and to download it onto electronic, magnetic, optical or similar storage media provided that such activities are for private research, study or in-house use only. Any other use of the material requires the formal written permission of Land Registry which can be requested from us, and is subject to an additional licence and associated charge.
Rightmove takes no liability for your use of, or reliance on, Rightmove's Instant Valuation due to the limitations of our tracking tool listed here. Use of this tool is taken entirely at your own risk. All rights reserved.