
House Prices in Drakelow
House prices in Drakelow have an overall average of £285,490 over the last year.
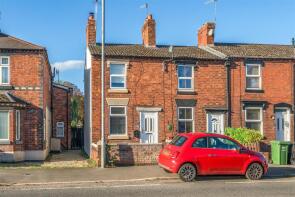
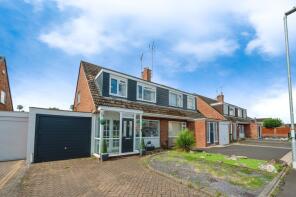
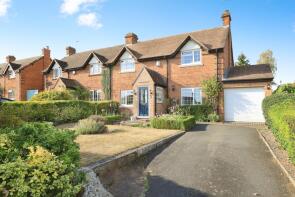
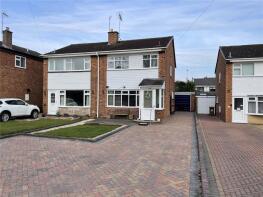
The majority of properties sold in Drakelow during the last year were semi-detached properties, selling for an average price of £269,232. Detached properties sold for an average of £398,202, with terraced properties fetching £197,600.
Overall, the historical sold prices in Drakelow over the last year were 4% down on the previous year and 1% down on the 2022 peak of £288,739.
Properties Sold
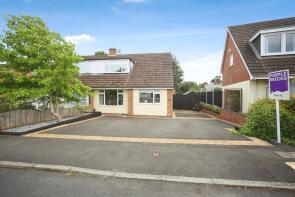
41, Tynings Close, Kidderminster DY11 5JP
| Today | See what it's worth now |
| 20 Mar 2026 | £285,000 |
| 7 Mar 2014 | £151,000 |
107, Franche Road, Kidderminster DY11 5BJ
| Today | See what it's worth now |
| 18 Mar 2026 | £165,000 |
| 19 Jan 2018 | £145,000 |
75, Wilton Avenue, Kidderminster DY11 5QF
| Today | See what it's worth now |
| 16 Mar 2026 | £225,000 |
| 23 Oct 2015 | £120,000 |
No other historical records.
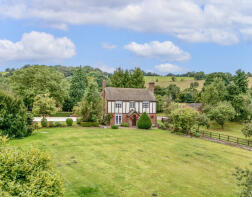
Orchard House, Horseley Hills Lane, Wolverley DY11 5TD
| Today | See what it's worth now |
| 5 Mar 2026 | £915,000 |
No other historical records.
63, Franche Road, Kidderminster DY11 5AL
| Today | See what it's worth now |
| 27 Feb 2026 | £173,500 |
| 1 Nov 2023 | £170,000 |
221, Marlpool Lane, Kidderminster DY11 5DL

| Today | See what it's worth now |
| 20 Feb 2026 | £280,000 |
| 24 Aug 2018 | £182,500 |
12, Aldermere Road, Kidderminster DY11 5HN
| Today | See what it's worth now |
| 18 Feb 2026 | £250,000 |
| 21 Nov 2022 | £240,000 |
30, Fairfield Lane, Kidderminster DY11 5QJ
| Today | See what it's worth now |
| 6 Feb 2026 | £350,000 |
| 22 Apr 2015 | £210,000 |
29, Court Close, Kidderminster DY11 5YZ

| Today | See what it's worth now |
| 6 Feb 2026 | £300,000 |
| 17 Jun 2011 | £165,000 |
No other historical records.
144, Marlpool Lane, Kidderminster DY11 5HS
| Today | See what it's worth now |
| 3 Feb 2026 | £235,000 |
| 22 Oct 1999 | £66,000 |
No other historical records.
1, Forest Grange, Willowfield Drive, Kidderminster DY11 5AS
| Today | See what it's worth now |
| 30 Jan 2026 | £317,000 |
| 29 Mar 2022 | £325,000 |
1, Broomfield Road, Kidderminster DY11 5PB
| Today | See what it's worth now |
| 30 Jan 2026 | £245,000 |
| 29 Sep 2021 | £245,000 |
No other historical records.
10, Audley Drive, Kidderminster DY11 5NE
| Today | See what it's worth now |
| 19 Jan 2026 | £250,000 |
| 25 Sep 2019 | £190,000 |
No other historical records.
16, The Orchards, Kidderminster DY11 5LJ
| Today | See what it's worth now |
| 16 Jan 2026 | £230,000 |
| 20 Sep 2007 | £166,000 |
No other historical records.
23, The Patios, Kidderminster DY11 5AB
| Today | See what it's worth now |
| 16 Jan 2026 | £170,000 |
| 19 Dec 2008 | £90,000 |
61, Marlpool Place, Kidderminster DY11 5BA
| Today | See what it's worth now |
| 6 Jan 2026 | £200,000 |
| 26 Mar 2004 | £125,000 |
42, Beaufort Avenue, Kidderminster DY11 5NJ
| Today | See what it's worth now |
| 19 Dec 2025 | £230,000 |
| 30 Jul 1996 | £56,000 |
18, Tynings Close, Kidderminster DY11 5JP
| Today | See what it's worth now |
| 19 Dec 2025 | £567,500 |
| 21 Sep 2016 | £322,500 |
18, Woodland Avenue, Kidderminster DY11 5AW
| Today | See what it's worth now |
| 18 Dec 2025 | £355,000 |
| 26 May 2006 | £186,950 |
No other historical records.
80, Aster Avenue, Kidderminster DY11 5DT
| Today | See what it's worth now |
| 17 Dec 2025 | £245,000 |
No other historical records.
81, Trimpley Drive, Kidderminster DY11 5LA
| Today | See what it's worth now |
| 12 Dec 2025 | £250,000 |
| 11 Oct 2021 | £235,000 |
15, Sebright Road, Wolverley DY11 5TZ
| Today | See what it's worth now |
| 8 Dec 2025 | £260,000 |
No other historical records.
49, Drake Crescent, Kidderminster DY11 6EB
| Today | See what it's worth now |
| 5 Dec 2025 | £190,000 |
| 3 Mar 2017 | £125,000 |
No other historical records.
9, Chestnut Court, Franche Road, Kidderminster DY11 5AL
| Today | See what it's worth now |
| 5 Dec 2025 | £114,100 |
| 6 Sep 2002 | £64,450 |
No other historical records.
34, Broomfield Close, Kidderminster DY11 5PD
| Today | See what it's worth now |
| 5 Dec 2025 | £235,000 |
| 7 Sep 2012 | £179,950 |
Source Acknowledgement: © Crown copyright. England and Wales house price data is publicly available information produced by the HM Land Registry.This material was last updated on 15 May 2026. It covers the period from 1 January 1995 to 31 March 2026 and contains property transactions which have been registered during that period. Contains HM Land Registry data © Crown copyright and database right 2026. This data is licensed under the Open Government Licence v3.0.
Disclaimer: Rightmove.co.uk provides this HM Land Registry data "as is". The burden for fitness of the data relies completely with the user and is provided for informational purposes only. No warranty, express or implied, is given relating to the accuracy of content of the HM Land Registry data and Rightmove does not accept any liability for error or omission. If you have found an error with the data or need further information please contact HM Land Registry.
Permitted Use: Viewers of this Information are granted permission to access this Crown copyright material and to download it onto electronic, magnetic, optical or similar storage media provided that such activities are for private research, study or in-house use only. Any other use of the material requires the formal written permission of Land Registry which can be requested from us, and is subject to an additional licence and associated charge.
Map data ©OpenStreetMap contributors.
Rightmove takes no liability for your use of, or reliance on, Rightmove's Instant Valuation due to the limitations of our tracking tool listed here. Use of this tool is taken entirely at your own risk. All rights reserved.