
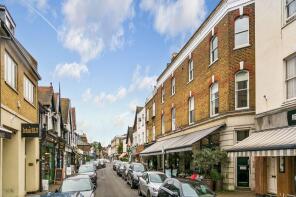
House Prices in East Molesey
House prices in East Molesey have an overall average of £806,253 over the last year.
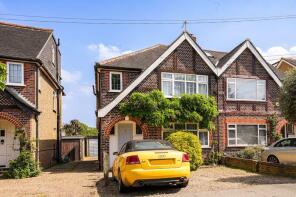
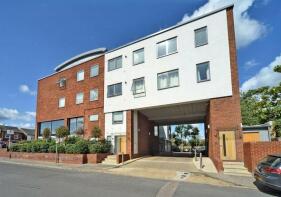
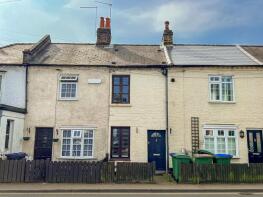
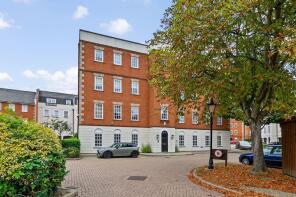
The majority of properties sold in East Molesey during the last year were flats, selling for an average price of £473,683. Semi-detached properties sold for an average of £997,532, with terraced properties fetching £703,146.
Overall, the historical sold prices in East Molesey over the last year were 19% down on the previous year and 22% down on the 2022 peak of £1,032,119.
Properties Sold
42, Hampton Court Avenue, East Molesey KT8 0BQ
| Today | See what it's worth now |
| 16 Apr 2026 | £800,000 |
| 1 May 1997 | £155,000 |
No other historical records.
Flat 17, 2 Kinsheron Place, Pemberton Road, East Molesey KT8 9LH
| Today | See what it's worth now |
| 31 Mar 2026 | £350,000 |
| 19 Oct 2020 | £455,000 |
No other historical records.
12, Walton Road, East Molesey KT8 0DF
| Today | See what it's worth now |
| 25 Mar 2026 | £397,000 |
| 20 Sep 2021 | £422,000 |
Flat 27, Ann Boleyn House, Queens Reach, East Molesey KT8 9DE
| Today | See what it's worth now |
| 19 Mar 2026 | £675,000 |
| 14 Nov 2018 | £590,000 |
Flat 58, Anne Of Cleves House, Queens Reach, East Molesey KT8 9DE

| Today | See what it's worth now |
| 19 Mar 2026 | £520,000 |
No other historical records.
Flat 28, Ann Boleyn House, Queens Reach, East Molesey KT8 9DE

| Today | See what it's worth now |
| 13 Mar 2026 | £649,995 |
| 19 Sep 2014 | £579,950 |
Flat 9, Hampton Court Mews, Feltham Avenue, East Molesey KT8 9BT
| Today | See what it's worth now |
| 9 Mar 2026 | £469,000 |
| 18 Nov 2015 | £490,000 |
Roma, Molember Road, East Molesey KT8 9NH

| Today | See what it's worth now |
| 9 Mar 2026 | £1,408,000 |
No other historical records.
43, Esher Road, East Molesey KT8 0AH
| Today | See what it's worth now |
| 30 Jan 2026 | £485,000 |
| 30 Aug 2000 | £420,000 |
4, Cedar Close, East Molesey KT8 9HR
| Today | See what it's worth now |
| 26 Jan 2026 | £975,000 |
No other historical records.
Flat 47, Jane Seymour House, Queens Reach, East Molesey KT8 9DE

| Today | See what it's worth now |
| 9 Jan 2026 | £950,000 |
| 27 Feb 1998 | £350,000 |
No other historical records.
13, Pavilion Place, East Molesey KT8 9FE
| Today | See what it's worth now |
| 9 Jan 2026 | £1,000,000 |
| 18 Dec 2020 | £940,000 |
No other historical records.
3, 149 Pemberton Terrace, Walton Road, East Molesey KT8 0AF
| Today | See what it's worth now |
| 17 Dec 2025 | £785,000 |
| 20 May 2021 | £675,000 |
25, Dennis Road, East Molesey KT8 9EE
| Today | See what it's worth now |
| 12 Dec 2025 | £617,500 |
| 18 Jun 2020 | £575,000 |
46, Summer Road, East Molesey KT8 9LS
| Today | See what it's worth now |
| 8 Dec 2025 | £1,075,000 |
| 14 Oct 2019 | £768,000 |
184, Walton Road, East Molesey KT8 0HR
| Today | See what it's worth now |
| 5 Dec 2025 | £355,000 |
| 30 Nov 2018 | £315,000 |
26b, Palace Road, East Molesey KT8 9DL
| Today | See what it's worth now |
| 26 Nov 2025 | £580,000 |
| 20 Oct 2017 | £450,000 |
No other historical records.
32, Matham Road, East Molesey KT8 0SU
| Today | See what it's worth now |
| 24 Nov 2025 | £1,165,000 |
| 16 Jun 2021 | £1,060,000 |
112, Kings Chase, East Molesey KT8 9DH
| Today | See what it's worth now |
| 17 Nov 2025 | £620,000 |
| 1 Jul 2019 | £550,000 |
21, Vine Road, East Molesey KT8 9LF
| Today | See what it's worth now |
| 10 Nov 2025 | £2,100,000 |
| 4 Jan 2012 | £650,000 |
No other historical records.
Flat 3, Bay Lodge, Hampton Court Road, East Molesey KT8 9DA
| Today | See what it's worth now |
| 7 Nov 2025 | £510,000 |
| 26 Feb 2001 | £180,000 |
34, Kent Road, East Molesey KT8 9JZ

| Today | See what it's worth now |
| 7 Nov 2025 | £1,075,000 |
| 31 Aug 2001 | £425,000 |
No other historical records.
4, Kent Road, East Molesey KT8 9JZ
| Today | See what it's worth now |
| 31 Oct 2025 | £1,130,000 |
No other historical records.
Source Acknowledgement: © Crown copyright. England and Wales house price data is publicly available information produced by the HM Land Registry.This material was last updated on 9 July 2026. It covers the period from 1 January 1995 to 30 April 2026 and contains property transactions which have been registered during that period. Contains HM Land Registry data © Crown copyright and database right 2026. This data is licensed under the Open Government Licence v3.0.
Disclaimer: Rightmove.co.uk provides this HM Land Registry data "as is". The burden for fitness of the data relies completely with the user and is provided for informational purposes only. No warranty, express or implied, is given relating to the accuracy of content of the HM Land Registry data and Rightmove does not accept any liability for error or omission. If you have found an error with the data or need further information please contact HM Land Registry.
Permitted Use: Viewers of this Information are granted permission to access this Crown copyright material and to download it onto electronic, magnetic, optical or similar storage media provided that such activities are for private research, study or in-house use only. Any other use of the material requires the formal written permission of Land Registry which can be requested from us, and is subject to an additional licence and associated charge.
Rightmove takes no liability for your use of, or reliance on, Rightmove's Instant Valuation due to the limitations of our tracking tool listed here. Use of this tool is taken entirely at your own risk. All rights reserved.