
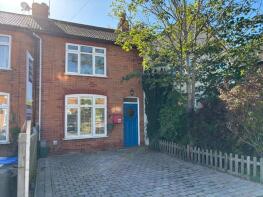
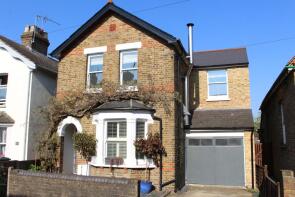
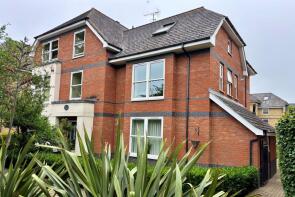
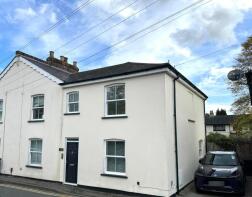
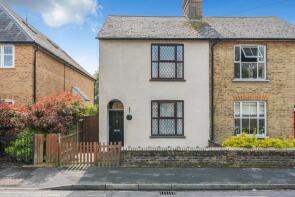
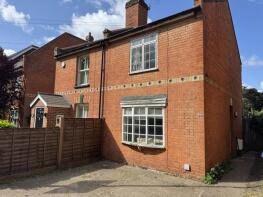
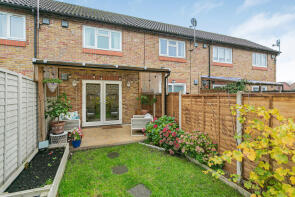
House Prices in Egham
House prices in Egham have an overall average of £495,796 over the last year.
The majority of properties sold in Egham during the last year were semi-detached properties, selling for an average price of £498,782. Terraced properties sold for an average of £396,947, with detached properties fetching £849,153.
Overall, the historical sold prices in Egham over the last year were 5% down on the previous year and 11% down on the 2021 peak of £559,296.
Properties Sold
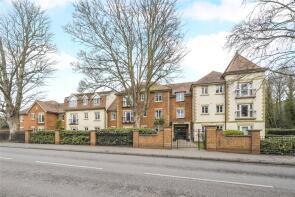
2, Windsor House, School Lane, Egham TW20 9GB
| Today | See what it's worth now |
| 22 Apr 2026 | £279,000 |
| 19 Mar 2007 | £231,000 |
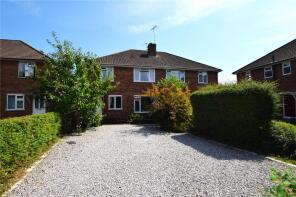
5, Glebe Road, Egham TW20 8BU
| Today | See what it's worth now |
| 22 Apr 2026 | £307,500 |
| 14 Mar 2005 | £178,000 |
1, 28 Foxleigh Court, New Road, Staines-upon-thames TW18 3DH
| Today | See what it's worth now |
| 16 Apr 2026 | £177,500 |
| 25 Nov 2005 | £143,000 |
96, Warwick Avenue, Egham TW20 8LS

| Today | See what it's worth now |
| 15 Apr 2026 | £365,000 |
| 4 Jun 1999 | £79,950 |
No other historical records.
30, Woodhaw, Egham TW20 9AR

| Today | See what it's worth now |
| 27 Mar 2026 | £460,000 |
| 26 Nov 2003 | £176,000 |
No other historical records.
8, Fairhaven Court, Fairhaven, Egham TW20 9DH

| Today | See what it's worth now |
| 27 Mar 2026 | £227,000 |
| 5 May 2022 | £215,000 |
28, Boshers Gardens, Egham TW20 9NZ
| Today | See what it's worth now |
| 24 Mar 2026 | £751,000 |
| 21 Jul 2017 | £620,000 |
35, Orchid Court, Albany Place, Egham TW20 9HA

| Today | See what it's worth now |
| 24 Mar 2026 | £152,000 |
| 1 Apr 2016 | £174,000 |
47, Willson Road, Egham TW20 0QB
| Today | See what it's worth now |
| 19 Mar 2026 | £420,000 |
| 28 Jun 2021 | £342,500 |
66, Hummer Road, Egham TW20 9BP
| Today | See what it's worth now |
| 19 Mar 2026 | £675,000 |
| 31 Aug 2012 | £488,000 |
2, Chancery Court, Vicarage Road, Egham TW20 9GG
| Today | See what it's worth now |
| 17 Mar 2026 | £268,000 |
| 30 Jun 2021 | £282,500 |
2a, Rusham Road, Egham TW20 9LS
| Today | See what it's worth now |
| 13 Mar 2026 | £315,000 |
| 11 Dec 2013 | £240,000 |
No other historical records.
Flat 2, Millers Court, Hythe Park Road, Egham TW20 8DL

| Today | See what it's worth now |
| 13 Mar 2026 | £180,000 |
| 17 May 2004 | £69,000 |
No other historical records.
1, Hythe Road, Staines-upon-thames TW18 3ED
| Today | See what it's worth now |
| 12 Mar 2026 | £470,000 |
| 14 Jul 2006 | £246,500 |
12, Runnymede Court, Egham TW20 9AA

| Today | See what it's worth now |
| 6 Mar 2026 | £240,000 |
| 15 Nov 2013 | £125,000 |
No other historical records.
45, St Judes Road, Egham TW20 0BT
| Today | See what it's worth now |
| 3 Mar 2026 | £337,000 |
| 6 Sep 1999 | £115,000 |
No other historical records.
21, South Avenue, Egham TW20 8HG

| Today | See what it's worth now |
| 27 Feb 2026 | £650,000 |
No other historical records.
25, Mullens Road, Egham TW20 8AG
| Today | See what it's worth now |
| 26 Feb 2026 | £315,000 |
| 7 Feb 2022 | £278,000 |
19, Henley Court, Denham Road, Egham TW20 9DZ
| Today | See what it's worth now |
| 26 Feb 2026 | £262,500 |
| 28 Jun 2021 | £255,000 |
133, Pooley Green Road, Egham TW20 8AW
| Today | See what it's worth now |
| 26 Feb 2026 | £485,000 |
| 4 Oct 1996 | £83,000 |
No other historical records.
81, Spring Rise, Egham TW20 9PR
| Today | See what it's worth now |
| 26 Feb 2026 | £720,000 |
| 3 Sep 2004 | £315,000 |
49, Ayebridges Avenue, Egham TW20 8HS
| Today | See what it's worth now |
| 20 Feb 2026 | £580,000 |
| 26 Jul 2012 | £397,500 |
1, Goring Road, Staines-upon-thames TW18 3EH
| Today | See what it's worth now |
| 20 Feb 2026 | £595,000 |
| 18 Sep 2017 | £500,000 |
Source Acknowledgement: © Crown copyright. England and Wales house price data is publicly available information produced by the HM Land Registry.This material was last updated on 9 July 2026. It covers the period from 1 January 1995 to 30 April 2026 and contains property transactions which have been registered during that period. Contains HM Land Registry data © Crown copyright and database right 2026. This data is licensed under the Open Government Licence v3.0.
Disclaimer: Rightmove.co.uk provides this HM Land Registry data "as is". The burden for fitness of the data relies completely with the user and is provided for informational purposes only. No warranty, express or implied, is given relating to the accuracy of content of the HM Land Registry data and Rightmove does not accept any liability for error or omission. If you have found an error with the data or need further information please contact HM Land Registry.
Permitted Use: Viewers of this Information are granted permission to access this Crown copyright material and to download it onto electronic, magnetic, optical or similar storage media provided that such activities are for private research, study or in-house use only. Any other use of the material requires the formal written permission of Land Registry which can be requested from us, and is subject to an additional licence and associated charge.
Rightmove takes no liability for your use of, or reliance on, Rightmove's Instant Valuation due to the limitations of our tracking tool listed here. Use of this tool is taken entirely at your own risk. All rights reserved.