
House Prices in Falmouth
House prices in Falmouth have an overall average of £362,941 over the last year.
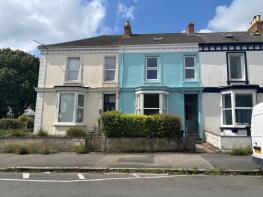
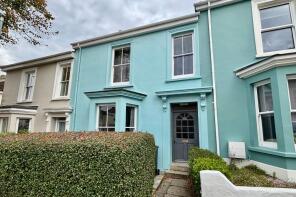
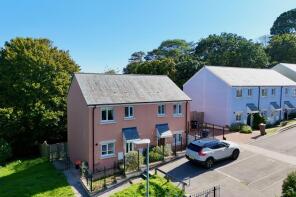
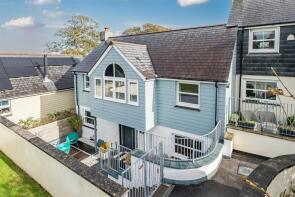
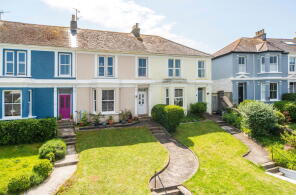
The majority of properties sold in Falmouth during the last year were terraced properties, selling for an average price of £357,280. Semi-detached properties sold for an average of £338,175, with flats fetching £253,885.
Overall, the historical sold prices in Falmouth over the last year were 12% down on the previous year and 10% down on the 2022 peak of £402,228.
Properties Sold
10, Albany Road, Falmouth TR11 3RW
| Today | See what it's worth now |
| 27 Apr 2026 | £400,000 |
| 8 Aug 2003 | £192,500 |
33, Trelawney Road, Falmouth TR11 3LT
| Today | See what it's worth now |
| 24 Apr 2026 | £445,000 |
| 30 Nov 1998 | £87,000 |
No other historical records.
1, Polmennor Road, Falmouth TR11 5UX

| Today | See what it's worth now |
| 22 Apr 2026 | £515,000 |
| 1 Feb 2010 | £230,000 |
No other historical records.
6, Portland Gardens, Falmouth TR11 2QT
| Today | See what it's worth now |
| 16 Apr 2026 | £310,000 |
No other historical records.
97, Longfield, Falmouth TR11 4SL
| Today | See what it's worth now |
| 15 Apr 2026 | £280,000 |
| 4 Jun 2021 | £238,000 |
5, Trevethan Court, Falmouth TR11 2UQ
| Today | See what it's worth now |
| 14 Apr 2026 | £367,500 |
| 14 Apr 2000 | £138,500 |
2, Berkeley Hill, Falmouth TR11 2BL

| Today | See what it's worth now |
| 13 Apr 2026 | £325,000 |
| 2 Oct 2020 | £230,000 |
88, Longfield, Falmouth TR11 4SL
| Today | See what it's worth now |
| 13 Apr 2026 | £245,000 |
| 14 Dec 2004 | £167,500 |
Fernlea, Swanpool, Falmouth TR11 5BA
| Today | See what it's worth now |
| 8 Apr 2026 | £475,000 |
| 1 Nov 2012 | £295,000 |
1, Link Close, Falmouth TR11 4AB

| Today | See what it's worth now |
| 2 Apr 2026 | £273,750 |
No other historical records.
13, Wellington Gardens, Wellington Terrace, Falmouth TR11 3BB
| Today | See what it's worth now |
| 2 Apr 2026 | £125,000 |
| 1 Jul 2015 | £165,000 |
27, Park Rise, Falmouth TR11 2DS
| Today | See what it's worth now |
| 2 Apr 2026 | £465,000 |
| 8 Sep 2011 | £220,000 |
No other historical records.
126, Boslowick Road, Falmouth TR11 4QF
| Today | See what it's worth now |
| 2 Apr 2026 | £427,500 |
| 3 Mar 2023 | £290,000 |
22, Admirals Quay, Packet Quays, Falmouth TR11 2UJ
| Today | See what it's worth now |
| 1 Apr 2026 | £260,000 |
| 18 Oct 2018 | £230,000 |
82, Trevethan Road, Falmouth TR11 2AU
| Today | See what it's worth now |
| 1 Apr 2026 | £330,000 |
| 10 May 2024 | £310,000 |
Flat 7, 4 Pantiles, Stracey Road, Falmouth TR11 4DW

| Today | See what it's worth now |
| 30 Mar 2026 | £235,000 |
| 18 Feb 2013 | £153,500 |
30, The Green, Falmouth TR11 5PR
| Today | See what it's worth now |
| 24 Mar 2026 | £458,000 |
| 6 Sep 2022 | £700,000 |
No other historical records.
221, Longfield, Falmouth TR11 4SR
| Today | See what it's worth now |
| 24 Mar 2026 | £262,500 |
| 28 Apr 2011 | £155,000 |
15, Raleigh Place, Falmouth TR11 3QJ
| Today | See what it's worth now |
| 23 Mar 2026 | £350,000 |
| 1 Mar 2019 | £255,000 |
No other historical records.
1, Arwyn Place, Bar Lane, Falmouth TR11 4BB

| Today | See what it's worth now |
| 23 Mar 2026 | £460,000 |
No other historical records.
76, Boscundle Avenue, Falmouth TR11 5BX

| Today | See what it's worth now |
| 23 Mar 2026 | £350,000 |
| 1 May 2014 | £199,995 |
No other historical records.
33, Messack Close, Falmouth TR11 4SH
| Today | See what it's worth now |
| 23 Mar 2026 | £375,000 |
| 11 Apr 2022 | £335,000 |
16, Nelsons Reach, Falmouth TR11 5GP
| Today | See what it's worth now |
| 19 Mar 2026 | £347,500 |
| 14 Dec 2020 | £291,950 |
No other historical records.
Source Acknowledgement: © Crown copyright. England and Wales house price data is publicly available information produced by the HM Land Registry.This material was last updated on 9 July 2026. It covers the period from 1 January 1995 to 30 April 2026 and contains property transactions which have been registered during that period. Contains HM Land Registry data © Crown copyright and database right 2026. This data is licensed under the Open Government Licence v3.0.
Disclaimer: Rightmove.co.uk provides this HM Land Registry data "as is". The burden for fitness of the data relies completely with the user and is provided for informational purposes only. No warranty, express or implied, is given relating to the accuracy of content of the HM Land Registry data and Rightmove does not accept any liability for error or omission. If you have found an error with the data or need further information please contact HM Land Registry.
Permitted Use: Viewers of this Information are granted permission to access this Crown copyright material and to download it onto electronic, magnetic, optical or similar storage media provided that such activities are for private research, study or in-house use only. Any other use of the material requires the formal written permission of Land Registry which can be requested from us, and is subject to an additional licence and associated charge.
Rightmove takes no liability for your use of, or reliance on, Rightmove's Instant Valuation due to the limitations of our tracking tool listed here. Use of this tool is taken entirely at your own risk. All rights reserved.