
House Prices in Giltbrook
House prices in Giltbrook have an overall average of £248,432 over the last year.
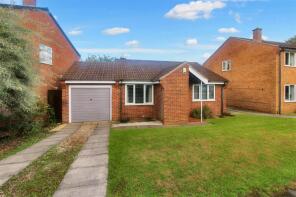
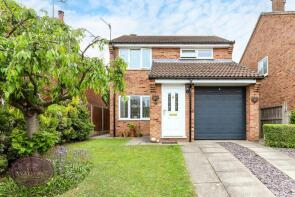
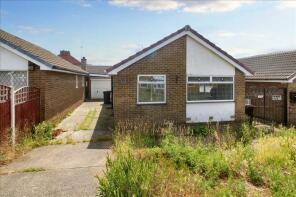
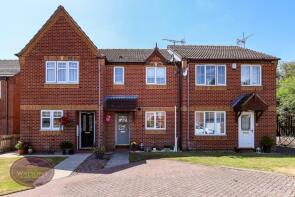
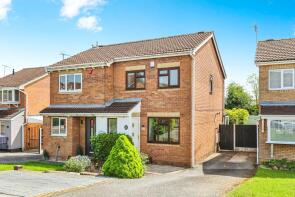
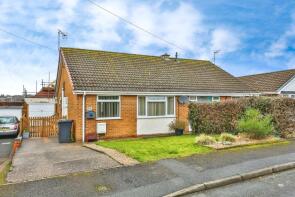
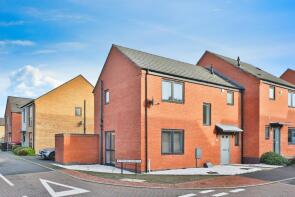
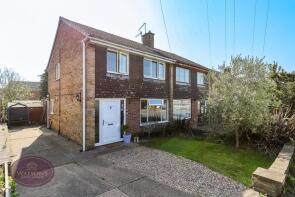
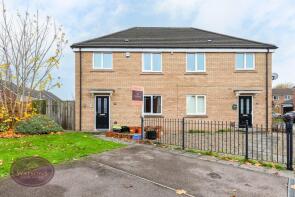
The majority of properties sold in Giltbrook during the last year were detached properties, selling for an average price of £287,656. Semi-detached properties sold for an average of £230,375, with terraced properties fetching £163,762.
Overall, the historical sold prices in Giltbrook over the last year were 7% down on the previous year and 2% up on the 2022 peak of £244,394.
Properties Sold
7, Brassington Close, Giltbrook NG16 2UH
| Today | See what it's worth now |
| 5 Dec 2025 | £210,000 |
No other historical records.
6, Weightman Drive, Nottingham NG16 2UQ
| Today | See what it's worth now |
| 3 Dec 2025 | £258,000 |
| 11 Aug 2023 | £225,000 |
21, Baldwin Street, Newthorpe NG16 2DS
| Today | See what it's worth now |
| 3 Dec 2025 | £190,000 |
No other historical records.
23, Sussex Close, Nottingham NG16 2XG
| Today | See what it's worth now |
| 3 Dec 2025 | £170,000 |
| 15 Dec 2023 | £160,500 |
7, Kent Road, Nottingham NG16 2FW
| Today | See what it's worth now |
| 21 Nov 2025 | £215,000 |
| 17 Aug 2007 | £124,500 |
17, Garner Road, Nottingham NG16 2WT
| Today | See what it's worth now |
| 21 Nov 2025 | £242,000 |
| 5 Oct 2018 | £192,000 |
No other historical records.
30, Acorn Avenue, Nottingham NG16 2UF
| Today | See what it's worth now |
| 14 Nov 2025 | £240,000 |
| 20 May 2016 | £170,000 |
33, Catkin Drive, Nottingham NG16 2UB
| Today | See what it's worth now |
| 30 Oct 2025 | £215,000 |
| 29 Feb 2008 | £133,000 |
15, The Pastures, Nottingham NG16 2UT
| Today | See what it's worth now |
| 29 Oct 2025 | £205,000 |
| 10 Sep 2021 | £177,000 |
33, Giltbrook Crescent, Nottingham NG16 2GH
| Today | See what it's worth now |
| 22 Oct 2025 | £215,000 |
| 20 Sep 2024 | £228,000 |
12, Giltbrook Crescent, Nottingham NG16 2GH
| Today | See what it's worth now |
| 22 Oct 2025 | £182,000 |
| 15 Apr 2016 | £115,000 |
No other historical records.
4, Goodman Close, Nottingham NG16 2UR
| Today | See what it's worth now |
| 17 Oct 2025 | £240,000 |
| 24 Aug 2018 | £175,000 |
28, Garner Road, Nottingham NG16 2WT
| Today | See what it's worth now |
| 9 Oct 2025 | £250,000 |
| 18 Dec 2018 | £198,500 |
No other historical records.
38, Smithurst Road, Nottingham NG16 2UD
| Today | See what it's worth now |
| 9 Oct 2025 | £325,000 |
| 30 Nov 2007 | £186,000 |
12, Kent Road, Nottingham NG16 2FU
| Today | See what it's worth now |
| 30 Sep 2025 | £185,000 |
| 5 May 2011 | £117,500 |
7, Hepworth Drive, Nottingham NG16 2WW
| Today | See what it's worth now |
| 17 Sep 2025 | £284,000 |
| 30 May 2018 | £201,995 |
No other historical records.
15, Catkin Drive, Giltbrook NG16 2UB
| Today | See what it's worth now |
| 15 Sep 2025 | £230,000 |
| 30 Aug 2024 | £225,000 |
25, Swindon Close, Nottingham NG16 2WD
| Today | See what it's worth now |
| 1 Sep 2025 | £242,500 |
| 10 Jul 2020 | £193,000 |
1, Veronica Drive, Nottingham NG16 2UE
| Today | See what it's worth now |
| 29 Aug 2025 | £300,000 |
| 28 Aug 2015 | £158,000 |
No other historical records.
20, The Heath, Nottingham NG16 2UU
| Today | See what it's worth now |
| 27 Aug 2025 | £300,000 |
| 14 Jan 2011 | £205,000 |
46, Baldwin Street, Nottingham NG16 2DS
| Today | See what it's worth now |
| 22 Aug 2025 | £191,000 |
| 11 Aug 2022 | £167,000 |
8, Davenport Drive, Nottingham NG16 2WU
| Today | See what it's worth now |
| 11 Aug 2025 | £245,000 |
| 24 Jun 2022 | £229,000 |
64, Kent Road, Nottingham NG16 2FU
| Today | See what it's worth now |
| 1 Aug 2025 | £215,000 |
| 1 Aug 2025 | £215,000 |
90, Smithurst Road, Giltbrook NG16 2UP

| Today | See what it's worth now |
| 25 Jul 2025 | £380,000 |
No other historical records.
14, Orchil Street, Nottingham NG16 2WS
| Today | See what it's worth now |
| 3 Jul 2025 | £125,000 |
| 26 Nov 2015 | £83,000 |
Source Acknowledgement: © Crown copyright. England and Wales house price data is publicly available information produced by the HM Land Registry.This material was last updated on 4 February 2026. It covers the period from 1 January 1995 to 24 December 2025 and contains property transactions which have been registered during that period. Contains HM Land Registry data © Crown copyright and database right 2026. This data is licensed under the Open Government Licence v3.0.
Disclaimer: Rightmove.co.uk provides this HM Land Registry data "as is". The burden for fitness of the data relies completely with the user and is provided for informational purposes only. No warranty, express or implied, is given relating to the accuracy of content of the HM Land Registry data and Rightmove does not accept any liability for error or omission. If you have found an error with the data or need further information please contact HM Land Registry.
Permitted Use: Viewers of this Information are granted permission to access this Crown copyright material and to download it onto electronic, magnetic, optical or similar storage media provided that such activities are for private research, study or in-house use only. Any other use of the material requires the formal written permission of Land Registry which can be requested from us, and is subject to an additional licence and associated charge.
Map data ©OpenStreetMap contributors.
Rightmove takes no liability for your use of, or reliance on, Rightmove's Instant Valuation due to the limitations of our tracking tool listed here. Use of this tool is taken entirely at your own risk. All rights reserved.