
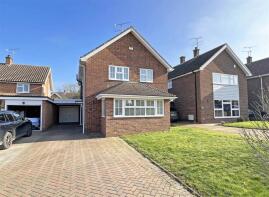
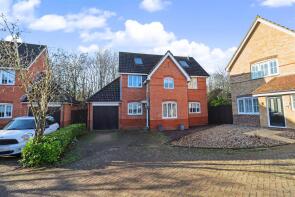
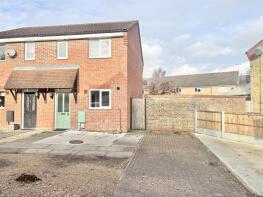
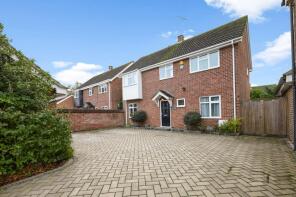
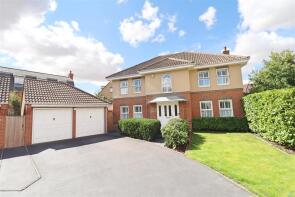
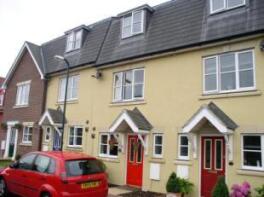
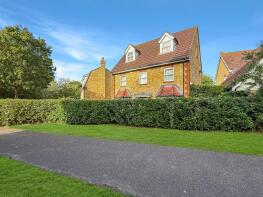
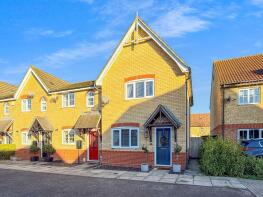
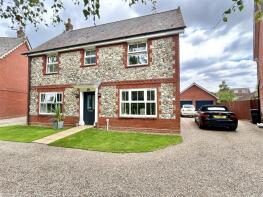
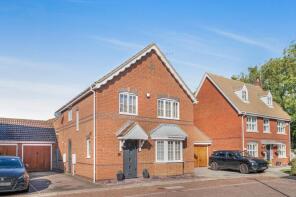
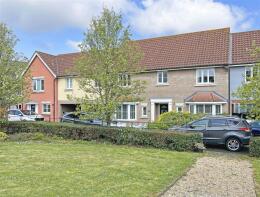
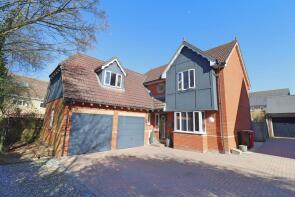
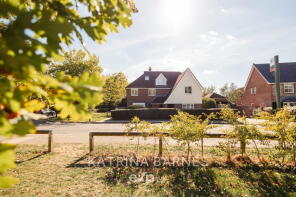
House Prices in Great Notley
House prices in Great Notley have an overall average of £458,724 over the last year.
The majority of properties sold in Great Notley during the last year were detached properties, selling for an average price of £548,902. Semi-detached properties sold for an average of £366,033, with terraced properties fetching £325,611.
Overall, the historical sold prices in Great Notley over the last year were similar to the previous year and 5% down on the 2022 peak of £481,575.
Properties Sold
12, Maylands Drive, Braintree CM77 7PY
| Today | See what it's worth now |
| 27 Apr 2026 | £490,000 |
| 23 Jul 2001 | £147,500 |
No other historical records.
39, Wood Way, Braintree CM77 7JS
| Today | See what it's worth now |
| 17 Apr 2026 | £450,000 |
| 10 Dec 2014 | £342,500 |
61, Stanstrete Field, Braintree CM77 7PR
| Today | See what it's worth now |
| 7 Apr 2026 | £291,500 |
| 21 Dec 2009 | £147,000 |
117, Grantham Avenue, Braintree CM77 7FP

| Today | See what it's worth now |
| 30 Mar 2026 | £550,000 |
| 31 Oct 2002 | £300,000 |
No other historical records.
85, Stanstrete Field, Braintree CM77 7JW

| Today | See what it's worth now |
| 27 Mar 2026 | £150,000 |
| 15 Jul 2014 | £101,000 |
12, Thirlmere Close, Braintree CM77 7UL
| Today | See what it's worth now |
| 27 Mar 2026 | £500,000 |
| 8 Jul 2020 | £427,500 |
4, Hardwick Close, Braintree CM77 7FQ
| Today | See what it's worth now |
| 27 Mar 2026 | £640,000 |
| 9 May 2003 | £329,995 |
7, Coopers Crescent, Braintree CM77 7DG
| Today | See what it's worth now |
| 27 Mar 2026 | £325,000 |
| 15 Feb 2008 | £212,500 |
76, Cuckoo Way, Braintree CM77 7WH

| Today | See what it's worth now |
| 26 Mar 2026 | £595,000 |
| 30 Jan 1998 | £174,995 |
No other historical records.
7, Audley Close, Braintree CM77 7ZU
| Today | See what it's worth now |
| 24 Mar 2026 | £550,000 |
| 18 Dec 2009 | £320,000 |
21, Timbers Close, Braintree CM77 7GZ
| Today | See what it's worth now |
| 24 Mar 2026 | £320,000 |
| 28 Apr 2017 | £265,000 |
3, Farriers Way, Braintree CM77 7XJ
| Today | See what it's worth now |
| 24 Mar 2026 | £610,000 |
| 10 May 2006 | £300,000 |
36, Derwent Way, Braintree CM77 7UX
| Today | See what it's worth now |
| 20 Mar 2026 | £306,000 |
| 2 Apr 2014 | £205,000 |
10, Queenborough Lane, Braintree CM77 7QE
| Today | See what it's worth now |
| 20 Mar 2026 | £570,000 |
| 22 Apr 2022 | £425,000 |
No other historical records.
10, The Laurels, Queenborough Lane, Braintree CM77 7QD
| Today | See what it's worth now |
| 17 Mar 2026 | £645,000 |
| 22 Jun 2021 | £590,000 |
20, Great Notley Avenue, Braintree CM77 7UW
| Today | See what it's worth now |
| 6 Mar 2026 | £637,500 |
| 7 Feb 1997 | £135,000 |
5, Whitegates Close, Braintree CM77 7FX
| Today | See what it's worth now |
| 6 Mar 2026 | £480,000 |
| 14 Feb 2013 | £249,995 |
16, Chestnut Avenue, Braintree CM77 7YJ
| Today | See what it's worth now |
| 6 Mar 2026 | £525,000 |
| 11 Dec 2006 | £326,500 |
12, Audley Close, Braintree CM77 7ZU
| Today | See what it's worth now |
| 6 Mar 2026 | £560,000 |
| 20 Apr 2000 | £199,000 |
No other historical records.
17, Ennerdale Avenue, Great Notley CM77 7UE
| Today | See what it's worth now |
| 27 Feb 2026 | £425,000 |
No other historical records.
33, Grantham Avenue, Braintree CM77 7FP
| Today | See what it's worth now |
| 27 Feb 2026 | £600,000 |
| 18 Mar 2021 | £536,500 |
23, Crab Apple Drive, Black Notley, Braintree CM77 8FW
| Today | See what it's worth now |
| 16 Feb 2026 | £395,000 |
| 31 Jul 2019 | £390,000 |
No other historical records.
28, Timbers Close, Braintree CM77 7GZ
| Today | See what it's worth now |
| 6 Feb 2026 | £530,000 |
| 8 Apr 2010 | £355,000 |

Source Acknowledgement: © Crown copyright. England and Wales house price data is publicly available information produced by the HM Land Registry.This material was last updated on 9 July 2026. It covers the period from 1 January 1995 to 30 April 2026 and contains property transactions which have been registered during that period. Contains HM Land Registry data © Crown copyright and database right 2026. This data is licensed under the Open Government Licence v3.0.
Disclaimer: Rightmove.co.uk provides this HM Land Registry data "as is". The burden for fitness of the data relies completely with the user and is provided for informational purposes only. No warranty, express or implied, is given relating to the accuracy of content of the HM Land Registry data and Rightmove does not accept any liability for error or omission. If you have found an error with the data or need further information please contact HM Land Registry.
Permitted Use: Viewers of this Information are granted permission to access this Crown copyright material and to download it onto electronic, magnetic, optical or similar storage media provided that such activities are for private research, study or in-house use only. Any other use of the material requires the formal written permission of Land Registry which can be requested from us, and is subject to an additional licence and associated charge.
Rightmove takes no liability for your use of, or reliance on, Rightmove's Instant Valuation due to the limitations of our tracking tool listed here. Use of this tool is taken entirely at your own risk. All rights reserved.