
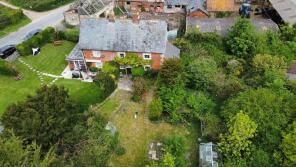
House Prices in Gurnard
House prices in Gurnard have an overall average of £374,444 over the last year.
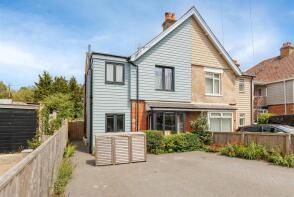
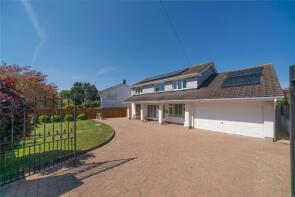
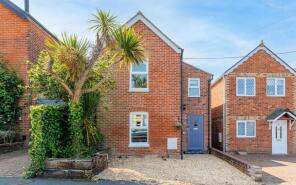
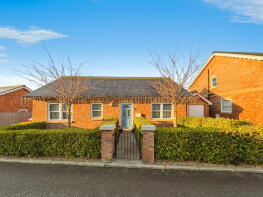
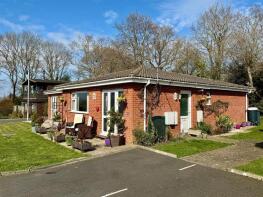
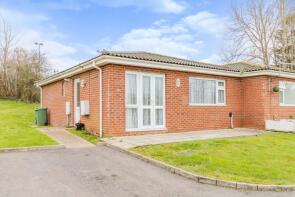
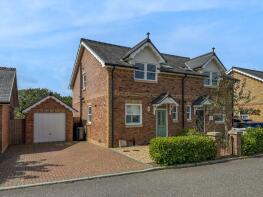
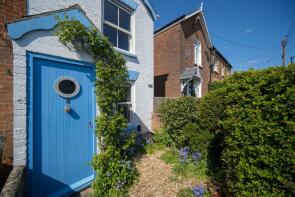
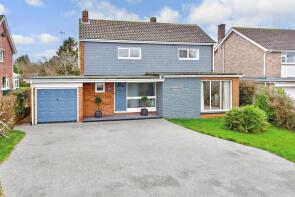
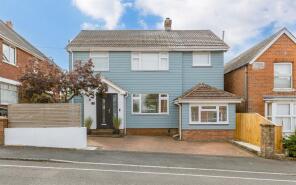
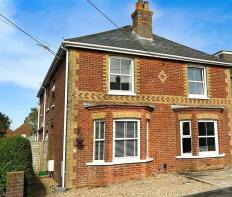
The majority of properties sold in Gurnard during the last year were semi-detached properties, selling for an average price of £263,750. Detached properties sold for an average of £550,000, with terraced properties fetching £337,500.
Overall, the historical sold prices in Gurnard over the last year were 36% down on the previous year and 33% down on the 2023 peak of £559,919.
Properties Sold
14, Worsley Road, Cowes PO31 8JN
| Today | See what it's worth now |
| 27 Nov 2025 | £485,000 |
| 12 Jul 2019 | £258,500 |
No other historical records.
115 Ash House, Baring Road, Cowes PO31 8DS
| Today | See what it's worth now |
| 4 Nov 2025 | £875,000 |
| 20 Jul 2017 | £595,000 |
36, Solent View Road, Cowes PO31 8JY
| Today | See what it's worth now |
| 6 Oct 2025 | £530,000 |
| 24 Aug 2011 | £360,000 |
No other historical records.
64, Albert Road, Cowes PO31 8JU
| Today | See what it's worth now |
| 29 Sep 2025 | £395,000 |
| 10 Aug 2018 | £258,000 |
19, Place Road, Cowes PO31 7UA

| Today | See what it's worth now |
| 26 Sep 2025 | £465,000 |
| 25 Apr 2014 | £240,000 |
7, Westview Road, Gurnard PO31 8NR


| Today | See what it's worth now |
| 5 Sep 2025 | £460,000 |
No other historical records.
223, Gurnard Pines, Cockleton Lane, Cowes PO31 8RL

| Today | See what it's worth now |
| 28 Aug 2025 | £105,000 |
No other historical records.
36 The Bungalow, Deauville Avenue, Gurnard, Cowes PO31 7GA
| Today | See what it's worth now |
| 26 Aug 2025 | £400,000 |
| 7 Feb 2020 | £225,000 |
No other historical records.
242, Gurnard Pines, Cockleton Lane, Cowes PO31 8RL
| Today | See what it's worth now |
| 22 Aug 2025 | £110,000 |
| 7 Oct 2022 | £107,000 |
No other historical records.
228, Gurnard Pines, Cockleton Lane, Cowes PO31 8RL
| Today | See what it's worth now |
| 20 Aug 2025 | £90,000 |
| 3 May 2022 | £99,950 |
35, Deauville Avenue, Gurnard, Cowes PO31 7GA
| Today | See what it's worth now |
| 16 Jul 2025 | £400,000 |
| 16 Dec 2020 | £330,000 |
No other historical records.
Campview, Rew Street, Gurnard PO31 8NS
| Today | See what it's worth now |
| 1 Jul 2025 | £280,000 |
No other historical records.
24, Albert Road, Cowes PO31 8JU
| Today | See what it's worth now |
| 27 Jun 2025 | £485,000 |
| 18 Jun 2014 | £300,000 |
45, Worsley Road, Gurnard PO31 8JR
| Today | See what it's worth now |
| 19 Jun 2025 | £640,000 |
No other historical records.
141, Gurnard Pines, Cockleton Lane, Gurnard PO31 8RN
| Today | See what it's worth now |
| 6 Jun 2025 | £47,000 |
No other historical records.
22, Gurnard Pines, Cockleton Lane, Cowes PO31 8RD

| Today | See what it's worth now |
| 23 May 2025 | £58,000 |
No other historical records.
52, Worsley Road, Cowes PO31 8JR

| Today | See what it's worth now |
| 16 May 2025 | £635,000 |
| 30 Aug 1995 | £78,625 |
No other historical records.
8, The Avenue, Cowes PO31 8JL
| Today | See what it's worth now |
| 2 May 2025 | £280,000 |
| 22 Oct 2018 | £220,000 |
20, The Avenue, Cowes PO31 8JL

| Today | See what it's worth now |
| 26 Mar 2025 | £475,000 |
| 27 Apr 2012 | £227,500 |
134, Baring Road, Cowes PO31 8DS
| Today | See what it's worth now |
| 7 Mar 2025 | £800,000 |
| 20 Dec 2013 | £350,000 |
52, Albert Road, Cowes PO31 8JU
| Today | See what it's worth now |
| 7 Mar 2025 | £620,000 |
| 30 Oct 2020 | £470,000 |
29, Albert Road, Cowes PO31 8JU
| Today | See what it's worth now |
| 27 Feb 2025 | £430,000 |
| 1 Sep 2015 | £240,000 |
No other historical records.
150, Baring Road, Cowes PO31 8DS
| Today | See what it's worth now |
| 26 Feb 2025 | £530,000 |
No other historical records.
110, Baring Road, Cowes PO31 8DW

| Today | See what it's worth now |
| 14 Feb 2025 | £975,000 |
| 2 Apr 2019 | £446,000 |
No other historical records.
The Heritage, Tuttons Hill, Cowes PO31 8JA
| Today | See what it's worth now |
| 3 Feb 2025 | £850,000 |
| 5 Sep 2017 | £645,000 |
Source Acknowledgement: © Crown copyright. England and Wales house price data is publicly available information produced by the HM Land Registry.This material was last updated on 4 February 2026. It covers the period from 1 January 1995 to 24 December 2025 and contains property transactions which have been registered during that period. Contains HM Land Registry data © Crown copyright and database right 2026. This data is licensed under the Open Government Licence v3.0.
Disclaimer: Rightmove.co.uk provides this HM Land Registry data "as is". The burden for fitness of the data relies completely with the user and is provided for informational purposes only. No warranty, express or implied, is given relating to the accuracy of content of the HM Land Registry data and Rightmove does not accept any liability for error or omission. If you have found an error with the data or need further information please contact HM Land Registry.
Permitted Use: Viewers of this Information are granted permission to access this Crown copyright material and to download it onto electronic, magnetic, optical or similar storage media provided that such activities are for private research, study or in-house use only. Any other use of the material requires the formal written permission of Land Registry which can be requested from us, and is subject to an additional licence and associated charge.
Map data ©OpenStreetMap contributors.
Rightmove takes no liability for your use of, or reliance on, Rightmove's Instant Valuation due to the limitations of our tracking tool listed here. Use of this tool is taken entirely at your own risk. All rights reserved.