
House Prices in Harpenden
House prices in Harpenden have an overall average of £977,840 over the last year.
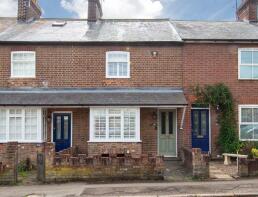
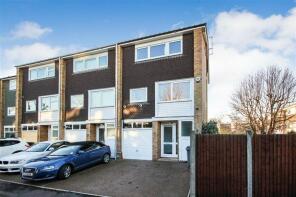
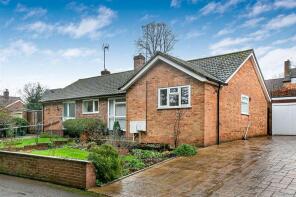
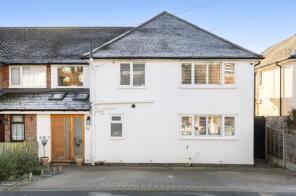
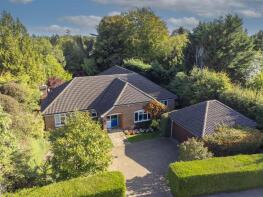
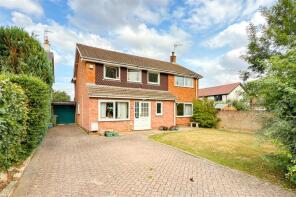
The majority of properties sold in Harpenden during the last year were detached properties, selling for an average price of £1,518,161. Semi-detached properties sold for an average of £941,975, with flats fetching £361,417.
Overall, the historical sold prices in Harpenden over the last year were 4% up on the previous year and 4% up on the 2023 peak of £943,975.
Properties Sold
2, Keats House, Milton Road, Harpenden AL5 5NZ
| Today | See what it's worth now |
| 21 Apr 2026 | £475,000 |
| 26 Mar 2020 | £200,000 |
12, Pigeonwick, Harpenden AL5 4EZ

| Today | See what it's worth now |
| 17 Apr 2026 | £800,000 |
| 30 Apr 2008 | £499,950 |
No other historical records.
154, Cravells Road, Harpenden AL5 1BQ
| Today | See what it's worth now |
| 2 Apr 2026 | £740,000 |
| 9 May 2018 | £603,000 |
6, Haddon Court, Shakespeare Road, Harpenden AL5 5NB
| Today | See what it's worth now |
| 2 Apr 2026 | £685,000 |
| 23 Nov 2010 | £398,500 |
160, Lower Luton Road, Harpenden AL5 5HA
| Today | See what it's worth now |
| 1 Apr 2026 | £515,000 |
| 9 May 2018 | £438,000 |
57, Barnfield Road, Harpenden AL5 5TH
| Today | See what it's worth now |
| 1 Apr 2026 | £992,500 |
| 10 Sep 2020 | £750,000 |
91, Coleswood Road, Harpenden AL5 1EG

| Today | See what it's worth now |
| 1 Apr 2026 | £760,000 |
| 19 Mar 2014 | £522,291 |
33, Churchfield, Harpenden AL5 1LJ
| Today | See what it's worth now |
| 31 Mar 2026 | £975,000 |
| 4 Jun 2010 | £404,000 |
No other historical records.
33, Long Buftlers, Harpenden AL5 1JF
| Today | See what it's worth now |
| 31 Mar 2026 | £1,320,000 |
| 26 Sep 2002 | £439,000 |
17, Park Hill, Harpenden AL5 3AT
| Today | See what it's worth now |
| 23 Mar 2026 | £725,600 |
| 12 Apr 2022 | £610,000 |
No other historical records.
7, Station Road, Harpenden AL5 4SA
| Today | See what it's worth now |
| 23 Mar 2026 | £251,000 |
| 7 Apr 2004 | £144,000 |
101, Grove Road, Harpenden AL5 1ER
| Today | See what it's worth now |
| 13 Mar 2026 | £500,000 |
| 4 Aug 2014 | £405,000 |
6, Green Lawns Close, Kinsbourne Green, Harpenden AL5 3QD
| Today | See what it's worth now |
| 12 Mar 2026 | £1,280,000 |
| 14 May 2021 | £1,100,000 |
8, 48 Berkeley Court, Luton Road, Harpenden AL5 2UN
| Today | See what it's worth now |
| 11 Mar 2026 | £345,500 |
| 16 Nov 2018 | £335,000 |
Flat 15, Stephens Court, Station Road, Harpenden AL5 4FE
| Today | See what it's worth now |
| 9 Mar 2026 | £340,000 |
| 30 Jun 2008 | £275,000 |
No other historical records.
14, Croftwell, Harpenden AL5 1JG

| Today | See what it's worth now |
| 6 Mar 2026 | £1,090,000 |
No other historical records.
25, Haddon Court, Shakespeare Road, Harpenden AL5 5NB
| Today | See what it's worth now |
| 6 Mar 2026 | £730,000 |
| 20 Nov 2017 | £650,000 |
Flat 24, Stephens Court, Station Road, Harpenden AL5 4FE
| Today | See what it's worth now |
| 6 Mar 2026 | £300,000 |
| 30 Jun 2008 | £280,000 |
No other historical records.
1a The Bungalow, Wheatfield Road, Harpenden AL5 2NY
| Today | See what it's worth now |
| 5 Mar 2026 | £1,425,000 |
| 30 Jun 2000 | £665,000 |
No other historical records.
19, Albany Court, Milton Road, Harpenden AL5 5LU
| Today | See what it's worth now |
| 27 Feb 2026 | £375,000 |
No other historical records.
6, Bowling Close, Harpenden AL5 1QP
| Today | See what it's worth now |
| 27 Feb 2026 | £315,000 |
| 29 Aug 2019 | £302,000 |
No other historical records.
10, Grant Gardens, Harpenden AL5 4QD
| Today | See what it's worth now |
| 25 Feb 2026 | £1,530,000 |
No other historical records.
5, Amenbury Court, Avenue St Nicholas, Harpenden AL5 2BU
| Today | See what it's worth now |
| 24 Feb 2026 | £727,500 |
| 29 Mar 2023 | £640,000 |
Source Acknowledgement: © Crown copyright. England and Wales house price data is publicly available information produced by the HM Land Registry.This material was last updated on 9 July 2026. It covers the period from 1 January 1995 to 30 April 2026 and contains property transactions which have been registered during that period. Contains HM Land Registry data © Crown copyright and database right 2026. This data is licensed under the Open Government Licence v3.0.
Disclaimer: Rightmove.co.uk provides this HM Land Registry data "as is". The burden for fitness of the data relies completely with the user and is provided for informational purposes only. No warranty, express or implied, is given relating to the accuracy of content of the HM Land Registry data and Rightmove does not accept any liability for error or omission. If you have found an error with the data or need further information please contact HM Land Registry.
Permitted Use: Viewers of this Information are granted permission to access this Crown copyright material and to download it onto electronic, magnetic, optical or similar storage media provided that such activities are for private research, study or in-house use only. Any other use of the material requires the formal written permission of Land Registry which can be requested from us, and is subject to an additional licence and associated charge.
Rightmove takes no liability for your use of, or reliance on, Rightmove's Instant Valuation due to the limitations of our tracking tool listed here. Use of this tool is taken entirely at your own risk. All rights reserved.