
House Prices in High Orchard
House prices in High Orchard have an overall average of £246,841 over the last year.
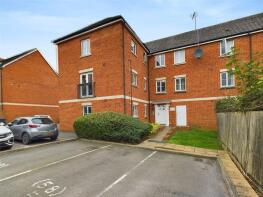
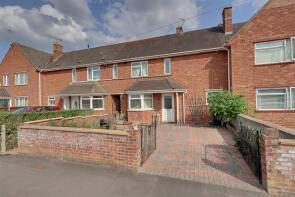
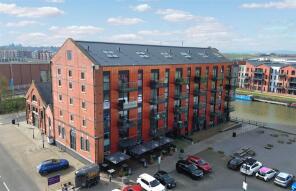
The majority of properties sold in High Orchard during the last year were flats, selling for an average price of £154,938. Semi-detached properties sold for an average of £266,000, with terraced properties fetching £214,117.
Overall, the historical sold prices in High Orchard over the last year were 11% down on the previous year and 4% down on the 2023 peak of £255,945.
Properties Sold
Flat 6, 58, Tolsey Gardens, Gloucester GL4 0DR
| Today | See what it's worth now |
| 11 Feb 2026 | £133,000 |
| 1 May 2015 | £105,000 |
92, Hempsted Lane, Gloucester GL2 5JS
| Today | See what it's worth now |
| 6 Feb 2026 | £585,000 |
No other historical records.
122, Barnwood Road, Gloucester GL4 3JW
| Today | See what it's worth now |
| 6 Feb 2026 | £310,000 |
| 20 Dec 2007 | £205,000 |
26, The Barge Arm, The Docks, Gloucester GL1 2DN

| Today | See what it's worth now |
| 30 Jan 2026 | £145,000 |
No other historical records.
23, North Upton Lane, Gloucester GL4 3TB
| Today | See what it's worth now |
| 9 Jan 2026 | £333,000 |
| 23 Oct 2015 | £246,000 |
No other historical records.
15, St Lawrence Road, Gloucester GL4 3QR
| Today | See what it's worth now |
| 9 Jan 2026 | £250,000 |
| 14 Oct 2011 | £138,995 |
329 Provender, Bakers Quay, St Ann Way, Gloucester GL1 5BQ
| Today | See what it's worth now |
| 9 Jan 2026 | £168,000 |
| 3 Sep 2018 | £180,000 |
No other historical records.
29, Sidney Street, Gloucester GL1 4DB
| Today | See what it's worth now |
| 9 Jan 2026 | £180,000 |
| 10 Nov 2006 | £114,000 |
43, The Barge Arm, The Docks, Gloucester GL1 2DN
| Today | See what it's worth now |
| 6 Jan 2026 | £209,000 |
| 13 Dec 2017 | £177,500 |
Flat 4, 10, Brunswick Square, Gloucester GL1 1UG
| Today | See what it's worth now |
| 23 Dec 2025 | £150,000 |
| 1 Sep 2022 | £150,000 |
221 Provender, Bakers Quay, St Ann Way, Gloucester GL1 5BQ
| Today | See what it's worth now |
| 19 Dec 2025 | £172,500 |
| 23 Oct 2019 | £167,500 |
No other historical records.
Flat 2, 17, St Johns Lane, Gloucester GL1 2AT
| Today | See what it's worth now |
| 19 Dec 2025 | £169,950 |
| 28 Apr 2017 | £107,495 |
No other historical records.
25, Millbrook Street, Gloucester GL1 4BG


| Today | See what it's worth now |
| 19 Dec 2025 | £110,000 |
No other historical records.
14, Chillingworth Mews, Gloucester GL1 1HH
| Today | See what it's worth now |
| 19 Dec 2025 | £220,000 |
| 14 Jul 2016 | £155,500 |
12, Colin Road, Gloucester GL4 3JL
| Today | See what it's worth now |
| 18 Dec 2025 | £310,000 |
| 19 Oct 1998 | £76,000 |
59, Kingstone Avenue, Hucclecote, Gloucester GL3 3AR
| Today | See what it's worth now |
| 18 Dec 2025 | £300,000 |
No other historical records.
12, Grove Crescent, Gloucester GL4 3JJ

| Today | See what it's worth now |
| 15 Dec 2025 | £375,000 |
| 22 May 2015 | £202,500 |
No other historical records.
89, Greenways, Gloucester GL4 3SA

| Today | See what it's worth now |
| 11 Dec 2025 | £282,000 |
| 27 Jun 2019 | £220,000 |
144, Barton Street, Gloucester GL1 4EN

| Today | See what it's worth now |
| 10 Dec 2025 | £250,000 |
No other historical records.
Flat 46, Llanthony Place, St Ann Way, Gloucester GL2 5GQ

| Today | See what it's worth now |
| 10 Dec 2025 | £170,000 |
| 26 Mar 2021 | £199,950 |
No other historical records.
201, 41 45 Pridays Mill, Commercial Road, Gloucester GL1 2ED

| Today | See what it's worth now |
| 5 Dec 2025 | £192,500 |
| 7 May 2003 | £130,000 |
No other historical records.
48, Derby Road, Gloucester GL1 4AE

| Today | See what it's worth now |
| 28 Nov 2025 | £255,000 |
| 25 Jan 2021 | £190,000 |
No other historical records.
4, The Forge, Gloucester GL2 5GH
| Today | See what it's worth now |
| 28 Nov 2025 | £267,500 |
| 30 Jun 2017 | £215,000 |
7, Wagon Way, Gloucester GL2 5EY
| Today | See what it's worth now |
| 27 Nov 2025 | £280,000 |
| 28 Jan 2011 | £161,452 |
No other historical records.
10, Durham Road, Gloucester GL4 3AS
| Today | See what it's worth now |
| 21 Nov 2025 | £312,000 |
| 29 Jul 2021 | £202,500 |
Source Acknowledgement: © Crown copyright. England and Wales house price data is publicly available information produced by the HM Land Registry.This material was last updated on 9 April 2026. It covers the period from 1 January 1995 to 27 February 2026 and contains property transactions which have been registered during that period. Contains HM Land Registry data © Crown copyright and database right 2026. This data is licensed under the Open Government Licence v3.0.
Disclaimer: Rightmove.co.uk provides this HM Land Registry data "as is". The burden for fitness of the data relies completely with the user and is provided for informational purposes only. No warranty, express or implied, is given relating to the accuracy of content of the HM Land Registry data and Rightmove does not accept any liability for error or omission. If you have found an error with the data or need further information please contact HM Land Registry.
Permitted Use: Viewers of this Information are granted permission to access this Crown copyright material and to download it onto electronic, magnetic, optical or similar storage media provided that such activities are for private research, study or in-house use only. Any other use of the material requires the formal written permission of Land Registry which can be requested from us, and is subject to an additional licence and associated charge.
Map data ©OpenStreetMap contributors.
Rightmove takes no liability for your use of, or reliance on, Rightmove's Instant Valuation due to the limitations of our tracking tool listed here. Use of this tool is taken entirely at your own risk. All rights reserved.