
House Prices in Kilburn
House prices in Kilburn have an overall average of £242,777 over the last year.
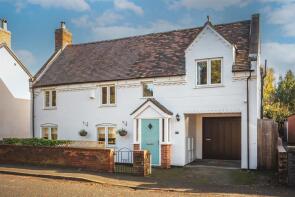
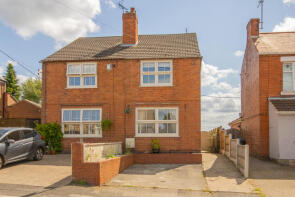
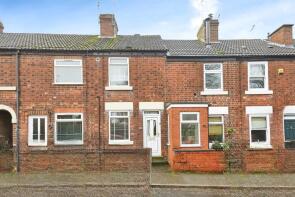
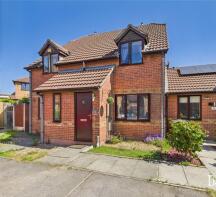
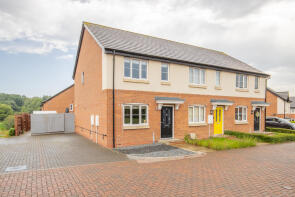
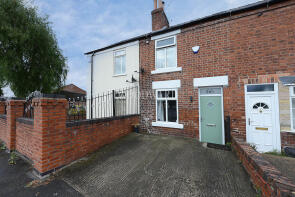
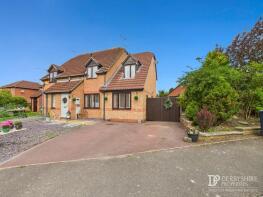
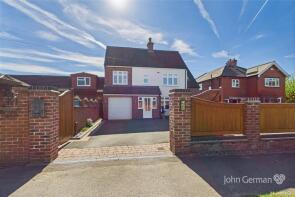
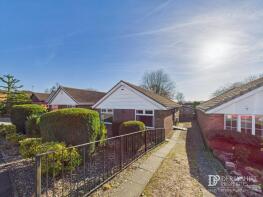
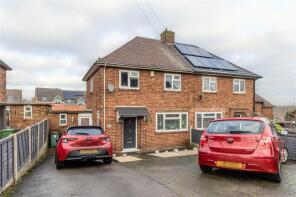
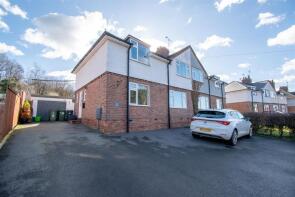
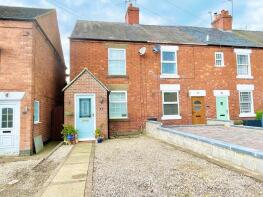
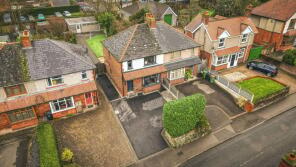
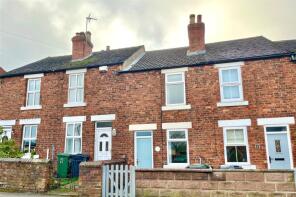
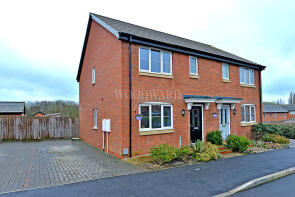
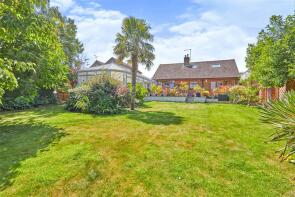
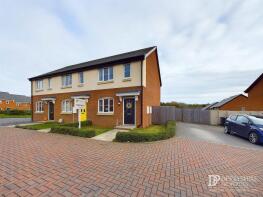
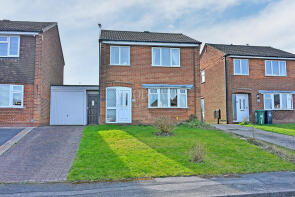
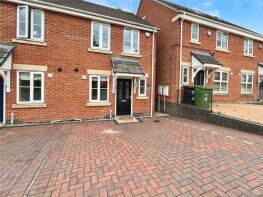
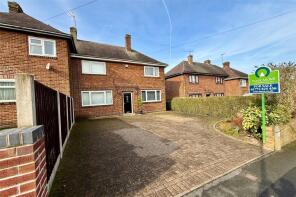
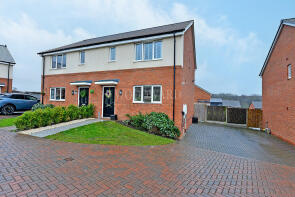
The majority of properties sold in Kilburn during the last year were semi-detached properties, selling for an average price of £229,406. Terraced properties sold for an average of £170,886, with detached properties fetching £368,369.
Overall, the historical sold prices in Kilburn over the last year were 15% up on the previous year and 8% up on the 2023 peak of £225,828.
Properties Sold
7, Church Street, Kilburn, Belper DE56 0LU
| Today | See what it's worth now |
| 10 Dec 2025 | £425,000 |
| 27 Oct 2017 | £297,000 |
32, Woodhouse Road, Kilburn, Belper DE56 0NA
| Today | See what it's worth now |
| 1 Dec 2025 | £218,000 |
| 29 Jan 2015 | £120,000 |
No other historical records.
14, Highfield Road, Kilburn, Belper DE56 0LT
| Today | See what it's worth now |
| 1 Dec 2025 | £130,000 |
| 30 Aug 2013 | £82,500 |
7, Blackthorne Close, Kilburn, Belper DE56 0LF
| Today | See what it's worth now |
| 1 Dec 2025 | £183,000 |
| 16 Jul 2021 | £153,000 |
20, Bottles Farm Close, Denby, Ripley DE5 8RP
| Today | See what it's worth now |
| 31 Oct 2025 | £198,000 |
| 22 Oct 2021 | £185,000 |
66, Derby Road, Lower Kilburn, Belper DE56 0NG
| Today | See what it's worth now |
| 24 Oct 2025 | £170,000 |
| 15 Mar 2021 | £130,000 |
No other historical records.
51, Bramble Way, Kilburn, Belper DE56 0LH
| Today | See what it's worth now |
| 23 Oct 2025 | £260,000 |
| 12 Apr 2024 | £148,000 |
No other historical records.
8, Ryknield Road, Kilburn, Belper DE56 0PE
| Today | See what it's worth now |
| 9 Oct 2025 | £357,000 |
| 11 Dec 2015 | £158,000 |
No other historical records.
95, Derby Road, Lower Kilburn, Belper DE56 0NH
| Today | See what it's worth now |
| 29 Sep 2025 | £475,000 |
| 7 Nov 2003 | £159,500 |
No other historical records.
37, Dale View Gardens, Kilburn, Belper DE56 0PT
| Today | See what it's worth now |
| 26 Sep 2025 | £205,000 |
| 13 Oct 2005 | £148,000 |
22, Kingsway Crescent, Kilburn, Belper DE56 0NX
| Today | See what it's worth now |
| 19 Sep 2025 | £180,000 |
| 26 Jun 2015 | £114,950 |
5, Brookvale Road, Denby, Ripley DE5 8NR
| Today | See what it's worth now |
| 2 Sep 2025 | £228,000 |
| 15 Feb 2019 | £194,000 |
46, Derby Road, Lower Kilburn, Belper DE56 0NG
| Today | See what it's worth now |
| 29 Aug 2025 | £172,500 |
| 28 May 2021 | £152,000 |
25, Highfield Road, Kilburn, Belper DE56 0LT
| Today | See what it's worth now |
| 27 Aug 2025 | £280,000 |
| 3 Aug 2012 | £108,500 |
No other historical records.
80, Danesby Rise, Denby, Ripley DE5 8RG
| Today | See what it's worth now |
| 26 Aug 2025 | £142,000 |
| 15 Sep 2017 | £106,000 |
4, Drury Lowe Close, Denby, Ripley DE5 8RN
| Today | See what it's worth now |
| 22 Aug 2025 | £235,000 |
| 4 Sep 2020 | £185,000 |
No other historical records.
147, Woodhouse Road, Horsley Woodhouse, Ilkeston DE7 6AY
| Today | See what it's worth now |
| 8 Aug 2025 | £560,000 |
| 1 Dec 1995 | £75,000 |
No other historical records.
16, Bottles Farm Close, Denby, Ripley DE5 8RP
| Today | See what it's worth now |
| 25 Jul 2025 | £185,000 |
| 7 May 2020 | £160,000 |
No other historical records.
22, Larch Road, Kilburn, Belper DE56 0PX
| Today | See what it's worth now |
| 17 Jul 2025 | £220,000 |
No other historical records.
3, Lapwing Close, Kilburn, Belper DE56 0AB
| Today | See what it's worth now |
| 14 Jul 2025 | £175,000 |
| 8 Sep 2017 | £135,000 |
18, Elm Tree Avenue, Kilburn, Belper DE56 0NW
| Today | See what it's worth now |
| 11 Jul 2025 | £235,000 |
| 26 Feb 2020 | £181,000 |
11, Bourne Place, Denby, Ripley DE5 8RJ
| Today | See what it's worth now |
| 7 Jul 2025 | £125,000 |
No other historical records.
1, Shaws Yard, Kilburn, Belper DE56 0LY
| Today | See what it's worth now |
| 10 Jun 2025 | £170,000 |
| 11 Mar 2016 | £132,000 |
17, Blackberry Way, Kilburn, Belper DE56 0LE

| Today | See what it's worth now |
| 23 May 2025 | £182,500 |
| 4 May 2001 | £57,750 |
10, Highfield Road, Kilburn, Belper DE56 0LT
| Today | See what it's worth now |
| 16 May 2025 | £167,250 |
| 29 Apr 2022 | £135,950 |
Source Acknowledgement: © Crown copyright. England and Wales house price data is publicly available information produced by the HM Land Registry.This material was last updated on 4 February 2026. It covers the period from 1 January 1995 to 24 December 2025 and contains property transactions which have been registered during that period. Contains HM Land Registry data © Crown copyright and database right 2026. This data is licensed under the Open Government Licence v3.0.
Disclaimer: Rightmove.co.uk provides this HM Land Registry data "as is". The burden for fitness of the data relies completely with the user and is provided for informational purposes only. No warranty, express or implied, is given relating to the accuracy of content of the HM Land Registry data and Rightmove does not accept any liability for error or omission. If you have found an error with the data or need further information please contact HM Land Registry.
Permitted Use: Viewers of this Information are granted permission to access this Crown copyright material and to download it onto electronic, magnetic, optical or similar storage media provided that such activities are for private research, study or in-house use only. Any other use of the material requires the formal written permission of Land Registry which can be requested from us, and is subject to an additional licence and associated charge.
Map data ©OpenStreetMap contributors.
Rightmove takes no liability for your use of, or reliance on, Rightmove's Instant Valuation due to the limitations of our tracking tool listed here. Use of this tool is taken entirely at your own risk. All rights reserved.