
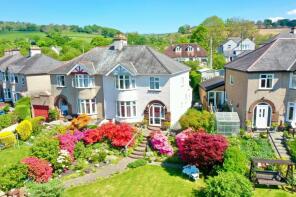
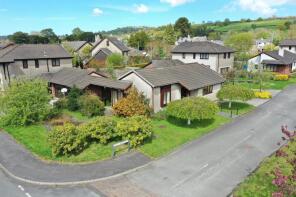
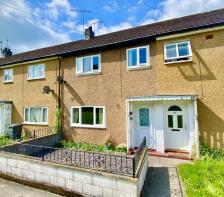
House Prices in LL26
House prices in LL26 have an overall average of £237,949 over the last year.
The majority of properties sold in LL26 during the last year were semi-detached properties, selling for an average price of £200,885. Terraced properties sold for an average of £161,108, with detached properties fetching £408,857.
Overall, the historical sold prices in LL26 over the last year were 12% up on the previous year and 3% down on the 2023 peak of £245,289.
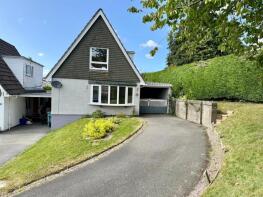
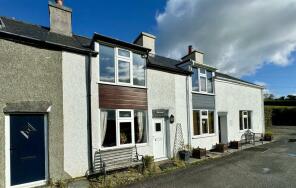
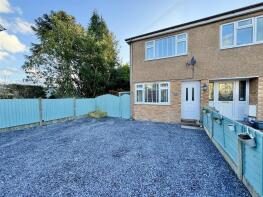
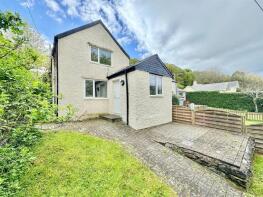
Properties Sold
Glasgwm, Llanddoged Road, Llanrwst LL26 0YU
| Today | See what it's worth now |
| 27 Mar 2026 | £277,500 |
| 19 Nov 1999 | £69,000 |
1, Llys Y Bioden, Llanrwst LL26 0LA
| Today | See what it's worth now |
| 27 Mar 2026 | £257,000 |
| 12 Dec 2014 | £175,000 |
No other historical records.
2, Gwydyr Cottages, Ancaster Square, Llanrwst LL26 0LD
| Today | See what it's worth now |
| 23 Mar 2026 | £150,000 |
| 7 Mar 2023 | £145,000 |
No other historical records.
Hen Goed, Parry Road, Llanrwst LL26 0DG
| Today | See what it's worth now |
| 13 Mar 2026 | £210,000 |
| 19 Jul 2017 | £150,000 |
6, Llys Y Wennol, Llanrwst LL26 0PH
| Today | See what it's worth now |
| 9 Mar 2026 | £325,000 |
| 12 Jan 2024 | £195,000 |
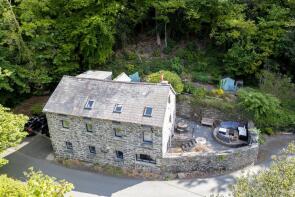
The Old Mill, Ffordd Hen Felin, Maenan, Llanrwst LL26 0UN
| Today | See what it's worth now |
| 13 Feb 2026 | £430,000 |
| 31 Mar 2016 | £300,000 |
No other historical records.
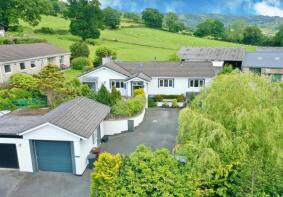
Cefn Bach Cottage, Llanrwst Road, Maenan, Llanrwst LL26 0YR
| Today | See what it's worth now |
| 10 Feb 2026 | £300,000 |
| 21 Oct 2016 | £125,000 |
No other historical records.
Cwm Hyfryd, Town Hill, Llanrwst LL26 0NF
| Today | See what it's worth now |
| 6 Feb 2026 | £415,000 |
| 15 May 2009 | £235,000 |
No other historical records.
40 Meirionfa, George Street, Llanrwst LL26 0DP
| Today | See what it's worth now |
| 30 Jan 2026 | £165,000 |
| 12 Feb 2024 | £144,000 |
7 Bwlch Y Gwynt, Trem Arfon, Llanrwst LL26 0BP
| Today | See what it's worth now |
| 15 Jan 2026 | £225,000 |
| 30 Nov 1998 | £50,000 |
4, Llan Isa, Capel Garmon To Rhyd Llanfair Road, Capel Garmon, Llanrwst LL26 0RR
| Today | See what it's worth now |
| 6 Jan 2026 | £131,000 |
| 31 Jan 2014 | £103,000 |
No other historical records.
15a, Maes Mawr, Llanrwst LL26 0HW
| Today | See what it's worth now |
| 19 Dec 2025 | £160,000 |
| 28 Mar 2022 | £159,950 |
3, Glan Ddol, Llanrwst Road, Maenan, Llanrwst LL26 0YP
| Today | See what it's worth now |
| 18 Dec 2025 | £140,000 |
| 4 Jan 2017 | £100,000 |
68, Cae Person, Llanrwst LL26 0HT
| Today | See what it's worth now |
| 25 Nov 2025 | £179,000 |
| 16 Jul 2018 | £142,950 |
1, Glan Ddol, Llanrwst Road, Maenan, Llanrwst LL26 0YP
| Today | See what it's worth now |
| 20 Nov 2025 | £145,000 |
| 4 Jan 2017 | £100,000 |
No other historical records.
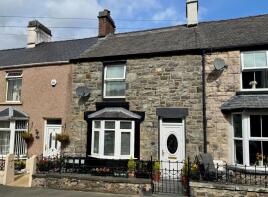
28, George Street, Llanrwst LL26 0DP
| Today | See what it's worth now |
| 20 Nov 2025 | £100,000 |
| 16 May 2008 | £80,000 |
No other historical records.
2, Felin Isa, Pendref, Llanrwst LL26 0BB
| Today | See what it's worth now |
| 18 Nov 2025 | £139,000 |
| 3 May 2002 | £42,000 |
No other historical records.
27a, Watling Street, Llanrwst LL26 0LS
| Today | See what it's worth now |
| 14 Nov 2025 | £130,000 |
| 5 Nov 2021 | £60,500 |
No other historical records.
Flat 5, Cwrt Victoria, Bridge Street, Llanrwst LL26 0GA
| Today | See what it's worth now |
| 13 Nov 2025 | £215,000 |
| 23 Nov 2010 | £180,000 |
No other historical records.
2, Cae Tyddyn, Llanrwst LL26 0BN
| Today | See what it's worth now |
| 4 Nov 2025 | £190,000 |
No other historical records.
Tyn Y Berth, Ffordd Fron Francis, Llanddoged, Llanrwst LL26 0TY
| Today | See what it's worth now |
| 31 Oct 2025 | £745,000 |
No other historical records.
32, Maes Melwr, Llanrwst LL26 0RY
| Today | See what it's worth now |
| 31 Oct 2025 | £240,000 |
| 29 May 2015 | £145,000 |
No other historical records.
31, Llwyn Brith, Llanrwst LL26 0HH
| Today | See what it's worth now |
| 23 Oct 2025 | £180,000 |
No other historical records.
Source Acknowledgement: © Crown copyright. England and Wales house price data is publicly available information produced by the HM Land Registry.This material was last updated on 9 July 2026. It covers the period from 1 January 1995 to 30 April 2026 and contains property transactions which have been registered during that period. Contains HM Land Registry data © Crown copyright and database right 2026. This data is licensed under the Open Government Licence v3.0.
Disclaimer: Rightmove.co.uk provides this HM Land Registry data "as is". The burden for fitness of the data relies completely with the user and is provided for informational purposes only. No warranty, express or implied, is given relating to the accuracy of content of the HM Land Registry data and Rightmove does not accept any liability for error or omission. If you have found an error with the data or need further information please contact HM Land Registry.
Permitted Use: Viewers of this Information are granted permission to access this Crown copyright material and to download it onto electronic, magnetic, optical or similar storage media provided that such activities are for private research, study or in-house use only. Any other use of the material requires the formal written permission of Land Registry which can be requested from us, and is subject to an additional licence and associated charge.
Rightmove takes no liability for your use of, or reliance on, Rightmove's Instant Valuation due to the limitations of our tracking tool listed here. Use of this tool is taken entirely at your own risk. All rights reserved.