
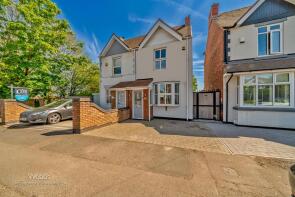
House Prices in Landywood
House prices in Landywood have an overall average of £289,668 over the last year.
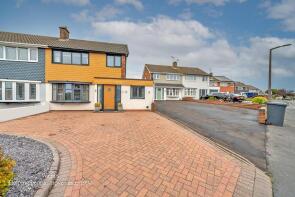
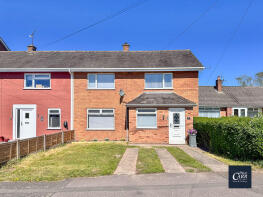
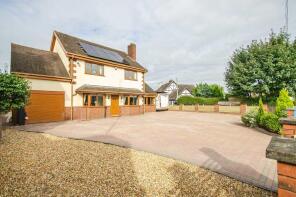
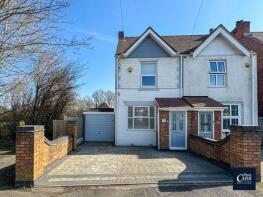
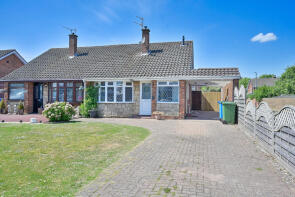
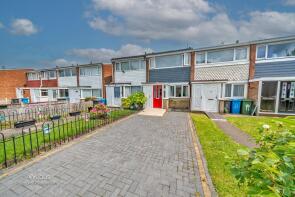
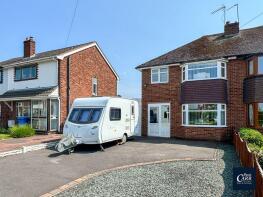
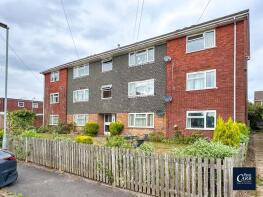
The majority of properties sold in Landywood during the last year were semi-detached properties, selling for an average price of £276,048. Detached properties sold for an average of £426,647, with terraced properties fetching £222,265.
Overall, the historical sold prices in Landywood over the last year were 13% up on the previous year and 19% up on the 2022 peak of £242,880.
Properties Sold
11, Bluebell Lane, Landywood, Walsall WS6 6HG
| Today | See what it's worth now |
| 21 Apr 2026 | £315,000 |
| 11 Jun 2020 | £192,500 |
No other historical records.
1a, Penny Court, Tower View Road, Walsall WS6 6HH
| Today | See what it's worth now |
| 10 Apr 2026 | £107,000 |
| 28 Apr 2023 | £97,500 |
151, Walsall Road, Walsall WS6 6NL
| Today | See what it's worth now |
| 31 Mar 2026 | £305,000 |
| 19 Oct 2020 | £213,500 |
273, Walsall Road, Walsall WS6 6DR
| Today | See what it's worth now |
| 30 Mar 2026 | £268,000 |
| 27 Apr 2022 | £255,000 |
5, Station Road, Walsall WS6 6LH

| Today | See what it's worth now |
| 27 Mar 2026 | £309,000 |
| 19 Aug 2019 | £215,000 |
No other historical records.
107, Gorsey Lane, Walsall WS6 6HJ
| Today | See what it's worth now |
| 27 Mar 2026 | £270,000 |
| 4 Jun 2021 | £200,000 |
No other historical records.
2, Landywood Lane, Walsall WS6 6JX
| Today | See what it's worth now |
| 20 Mar 2026 | £340,000 |
| 13 Jul 2007 | £315,000 |
No other historical records.
6, Bentons Lane, Walsall WS6 6EF
| Today | See what it's worth now |
| 13 Mar 2026 | £307,500 |
| 4 Jun 2021 | £258,700 |
84, Brook Lane, Walsall WS6 6BL
| Today | See what it's worth now |
| 12 Mar 2026 | £110,000 |
| 31 Mar 2016 | £80,000 |
2, Achilles Close, Walsall WS6 6JW

| Today | See what it's worth now |
| 13 Feb 2026 | £170,000 |
| 27 Jan 2023 | £140,000 |
9, Lichfield Close, Walsall WS6 6BE
| Today | See what it's worth now |
| 13 Feb 2026 | £390,000 |
| 21 Jul 2006 | £230,000 |
8, Park Lane, Great Wyrley WS6 6BN
| Today | See what it's worth now |
| 6 Feb 2026 | £156,000 |
No other historical records.
289, Walsall Road, Walsall WS6 6DR
| Today | See what it's worth now |
| 3 Feb 2026 | £500,000 |
| 3 Oct 2008 | £245,000 |
19, Hut Hill Lane, Walsall WS6 6PD
| Today | See what it's worth now |
| 30 Jan 2026 | £706,500 |
| 20 Oct 2017 | £405,000 |
576, Walsall Road, Walsall WS6 6AG
| Today | See what it's worth now |
| 23 Jan 2026 | £276,000 |
| 11 Jan 2019 | £210,000 |
54, Tower View Road, Walsall WS6 6HF
| Today | See what it's worth now |
| 16 Jan 2026 | £220,000 |
| 10 Oct 2003 | £110,000 |
No other historical records.
10, Leander Close, Walsall WS6 6JH
| Today | See what it's worth now |
| 8 Jan 2026 | £162,000 |
| 24 Mar 1995 | £28,000 |
No other historical records.
38, Manor Avenue, Great Wyrley WS6 6NS
| Today | See what it's worth now |
| 22 Dec 2025 | £269,950 |
No other historical records.
62, Alpha Way, Great Wyrley WS6 6AH
| Today | See what it's worth now |
| 22 Dec 2025 | £79,000 |
No other historical records.
134, Walsall Road, Walsall WS6 6LA
| Today | See what it's worth now |
| 18 Dec 2025 | £240,000 |
| 23 Dec 2002 | £120,000 |
33, Johns Lane, Walsall WS6 6BX
| Today | See what it's worth now |
| 18 Dec 2025 | £312,500 |
| 29 Jun 2012 | £130,000 |
No other historical records.
9, Hilton Lane, Great Wyrley WS6 6DS
| Today | See what it's worth now |
| 17 Dec 2025 | £285,000 |
No other historical records.
61, Bentons Lane, Walsall WS6 6EE
| Today | See what it's worth now |
| 8 Dec 2025 | £330,000 |
| 12 Oct 2001 | £95,000 |
Source Acknowledgement: © Crown copyright. England and Wales house price data is publicly available information produced by the HM Land Registry.This material was last updated on 9 July 2026. It covers the period from 1 January 1995 to 30 April 2026 and contains property transactions which have been registered during that period. Contains HM Land Registry data © Crown copyright and database right 2026. This data is licensed under the Open Government Licence v3.0.
Disclaimer: Rightmove.co.uk provides this HM Land Registry data "as is". The burden for fitness of the data relies completely with the user and is provided for informational purposes only. No warranty, express or implied, is given relating to the accuracy of content of the HM Land Registry data and Rightmove does not accept any liability for error or omission. If you have found an error with the data or need further information please contact HM Land Registry.
Permitted Use: Viewers of this Information are granted permission to access this Crown copyright material and to download it onto electronic, magnetic, optical or similar storage media provided that such activities are for private research, study or in-house use only. Any other use of the material requires the formal written permission of Land Registry which can be requested from us, and is subject to an additional licence and associated charge.
Rightmove takes no liability for your use of, or reliance on, Rightmove's Instant Valuation due to the limitations of our tracking tool listed here. Use of this tool is taken entirely at your own risk. All rights reserved.