
House Prices in Langley Mill
House prices in Langley Mill have an overall average of £200,552 over the last year.
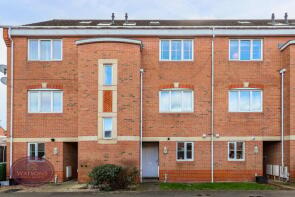
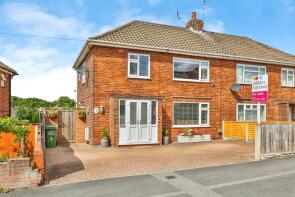
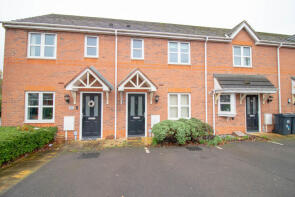
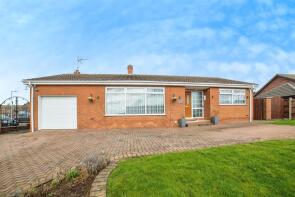
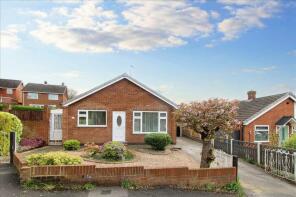
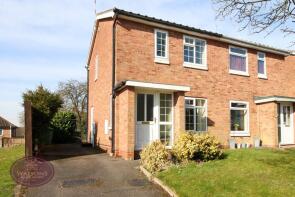
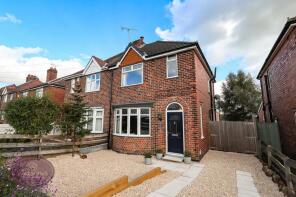
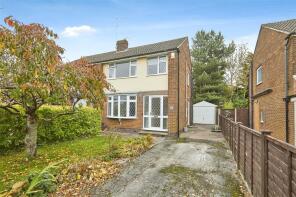
The majority of properties sold in Langley Mill during the last year were semi-detached properties, selling for an average price of £183,626. Terraced properties sold for an average of £154,071, with detached properties fetching £354,369.
Overall, the historical sold prices in Langley Mill over the last year were 18% up on the previous year and 18% up on the 2022 peak of £169,251.
Properties Sold
1a, Argyle Street, Langley Mill, Heanor NG16 4ET
| Today | See what it's worth now |
| 28 Nov 2025 | £200,000 |
No other historical records.
151, Cromford Road, Langley Mill, Nottingham NG16 4EU
| Today | See what it's worth now |
| 28 Nov 2025 | £98,500 |
| 4 Jul 2003 | £58,000 |
361, Cromford Road, Langley Mill, Nottingham NG16 4HA
| Today | See what it's worth now |
| 20 Nov 2025 | £490,000 |
| 10 Jul 2009 | £320,000 |
No other historical records.
5, Dean Street, Langley Mill, Nottingham NG16 4EG
| Today | See what it's worth now |
| 19 Nov 2025 | £125,000 |
| 23 Nov 2015 | £74,000 |
10, Bourne Drive, Langley Mill, Nottingham NG16 4BJ
| Today | See what it's worth now |
| 14 Nov 2025 | £101,500 |
| 7 Oct 2022 | £100,000 |
53, Ormonde Street, Langley Mill, Nottingham NG16 4FF

| Today | See what it's worth now |
| 10 Nov 2025 | £195,000 |
| 1 Dec 2017 | £113,000 |
No other historical records.
7, Horsley Crescent, Langley Mill, Nottingham NG16 4FX
| Today | See what it's worth now |
| 31 Oct 2025 | £190,000 |
| 6 Aug 2021 | £180,000 |
50, Bourne Drive, Langley Mill, Nottingham NG16 4BJ
| Today | See what it's worth now |
| 31 Oct 2025 | £140,000 |
| 11 Nov 2011 | £98,000 |
No other historical records.
101 Gelert, Andrews Drive, Langley Mill, Nottingham NG16 4GT
| Today | See what it's worth now |
| 24 Oct 2025 | £260,000 |
| 17 Nov 1997 | £49,000 |
No other historical records.
97, Ebenezer Street, Langley Mill, Nottingham NG16 4DA
| Today | See what it's worth now |
| 16 Oct 2025 | £365,000 |
| 22 Dec 2003 | £144,000 |
No other historical records.
58, Cromford Road, Langley Mill, Nottingham NG16 4EW
| Today | See what it's worth now |
| 3 Oct 2025 | £130,000 |
| 12 Jun 2020 | £115,000 |
No other historical records.
111, Milnhay Road, Langley Mill, Nottingham NG16 4AY
| Today | See what it's worth now |
| 26 Sep 2025 | £235,000 |
| 20 Sep 1996 | £48,000 |
No other historical records.
44, Sedgwick Street, Langley Mill, Nottingham NG16 4DT
| Today | See what it's worth now |
| 5 Sep 2025 | £179,500 |
| 3 Oct 2016 | £131,000 |
90, Upper Dunstead Road, Langley Mill, Heanor NG16 4GQ
| Today | See what it's worth now |
| 1 Sep 2025 | £160,000 |
No other historical records.
4, Daltons Close, Langley Mill, Nottingham NG16 4GP
| Today | See what it's worth now |
| 22 Aug 2025 | £180,000 |
| 29 Oct 2021 | £131,500 |
49, Pine Avenue, Langley Mill, Heanor NG16 4BA

| Today | See what it's worth now |
| 15 Aug 2025 | £140,000 |
No other historical records.
33, Bourne Drive, Langley Mill, Nottingham NG16 4BJ
| Today | See what it's worth now |
| 7 Aug 2025 | £130,000 |
| 27 Feb 2006 | £107,950 |
No other historical records.
341, Cromford Road, Langley Mill, Nottingham NG16 4HA

| Today | See what it's worth now |
| 6 Aug 2025 | £310,000 |
| 18 Aug 2017 | £195,000 |
Park Farm, Aldercar Lane, Langley Mill, Nottingham NG16 4HJ


| Today | See what it's worth now |
| 25 Jul 2025 | £650,000 |
No other historical records.
89, Station Road, Langley Mill, Nottingham NG16 4DU
| Today | See what it's worth now |
| 23 Jul 2025 | £380,000 |
| 15 Jan 2016 | £235,000 |
12, Hillside, Langley Mill, Heanor NG16 4FT
| Today | See what it's worth now |
| 21 Jul 2025 | £210,000 |
No other historical records.
39, Pine Avenue, Langley Mill, Heanor NG16 4BA
| Today | See what it's worth now |
| 16 Jul 2025 | £142,000 |
No other historical records.
81, Upper Dunstead Road, Langley Mill, Nottingham NG16 4FJ
| Today | See what it's worth now |
| 14 Jul 2025 | £121,774 |
| 28 Jun 2024 | £240,000 |
65, Milnhay Road, Langley Mill, Nottingham NG16 4AR
| Today | See what it's worth now |
| 4 Jul 2025 | £198,000 |
| 11 Feb 2011 | £114,950 |
No other historical records.
1, Hallam Grove, Langley Mill, Nottingham NG16 4HR
| Today | See what it's worth now |
| 27 Jun 2025 | £284,950 |
| 19 Jul 2019 | £234,950 |
No other historical records.
Source Acknowledgement: © Crown copyright. England and Wales house price data is publicly available information produced by the HM Land Registry.This material was last updated on 4 February 2026. It covers the period from 1 January 1995 to 24 December 2025 and contains property transactions which have been registered during that period. Contains HM Land Registry data © Crown copyright and database right 2026. This data is licensed under the Open Government Licence v3.0.
Disclaimer: Rightmove.co.uk provides this HM Land Registry data "as is". The burden for fitness of the data relies completely with the user and is provided for informational purposes only. No warranty, express or implied, is given relating to the accuracy of content of the HM Land Registry data and Rightmove does not accept any liability for error or omission. If you have found an error with the data or need further information please contact HM Land Registry.
Permitted Use: Viewers of this Information are granted permission to access this Crown copyright material and to download it onto electronic, magnetic, optical or similar storage media provided that such activities are for private research, study or in-house use only. Any other use of the material requires the formal written permission of Land Registry which can be requested from us, and is subject to an additional licence and associated charge.
Map data ©OpenStreetMap contributors.
Rightmove takes no liability for your use of, or reliance on, Rightmove's Instant Valuation due to the limitations of our tracking tool listed here. Use of this tool is taken entirely at your own risk. All rights reserved.