
House Prices in Lower Wanborough
House prices in Lower Wanborough have an overall average of £360,444 over the last year.
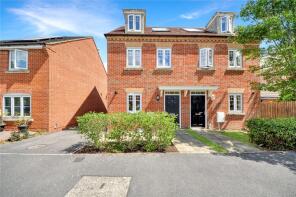
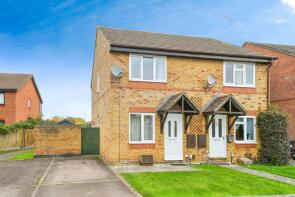
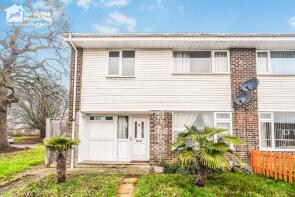
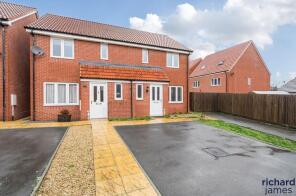
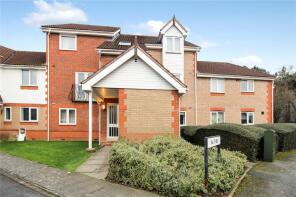
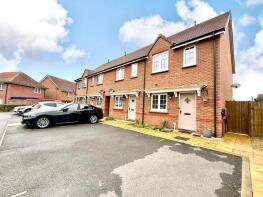
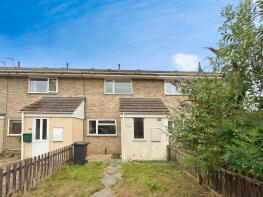
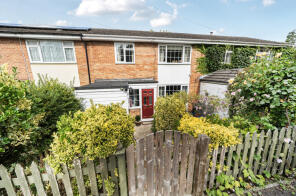
The majority of properties sold in Lower Wanborough during the last year were semi-detached properties, selling for an average price of £303,036. Terraced properties sold for an average of £250,208, with detached properties fetching £556,596.
Overall, the historical sold prices in Lower Wanborough over the last year were 3% down on the previous year and 3% down on the 2023 peak of £370,764.
Properties Sold
20, Dykes Mews, Chiseldon, Swindon SN4 0NF
| Today | See what it's worth now |
| 29 Apr 2026 | £220,000 |
| 20 Sep 2012 | £140,000 |
4, Clitchbury Close, Swindon SN3 6FP

| Today | See what it's worth now |
| 17 Apr 2026 | £296,000 |
| 6 Nov 2018 | £249,995 |
No other historical records.
6, Magpie Lane, Covingham, Swindon SN3 5DR
| Today | See what it's worth now |
| 10 Apr 2026 | £285,000 |
| 22 Aug 1997 | £66,000 |
No other historical records.
39, Langton Park, Wroughton, Swindon SN4 0QW
| Today | See what it's worth now |
| 10 Apr 2026 | £300,000 |
| 12 Feb 2016 | £202,500 |
59, Mallard Close, Covingham, Swindon SN3 5JG
| Today | See what it's worth now |
| 10 Apr 2026 | £242,000 |
| 29 Sep 2006 | £131,000 |
6, Lords Close, Wroughton, Swindon SN4 0FJ
| Today | See what it's worth now |
| 9 Apr 2026 | £340,000 |
| 19 Jul 2019 | £255,000 |
6, Nuthatch Close, Covingham, Swindon SN3 5LD
| Today | See what it's worth now |
| 8 Apr 2026 | £232,000 |
| 14 Nov 2003 | £114,000 |
5, Tryon Close, Liden, Swindon SN3 6HG
| Today | See what it's worth now |
| 2 Apr 2026 | £262,000 |
| 1 Jun 2018 | £190,000 |
No other historical records.
70, Bullfinch Close, Covingham, Swindon SN3 5HP

| Today | See what it's worth now |
| 2 Apr 2026 | £250,000 |
| 4 Dec 2015 | £165,000 |
3, Clitchbury Close, Swindon SN3 6FP
| Today | See what it's worth now |
| 31 Mar 2026 | £290,000 |
| 31 Oct 2018 | £249,995 |
No other historical records.
75, Mallard Close, Covingham, Swindon SN3 5JG
| Today | See what it's worth now |
| 31 Mar 2026 | £105,000 |
| 10 Jul 1998 | £36,750 |
No other historical records.
35, Lordswood, Swindon SN3 6EH
| Today | See what it's worth now |
| 27 Mar 2026 | £225,000 |
| 27 Oct 2017 | £231,950 |
No other historical records.
The Old Chapel, Chapel Lane, Wanborough, Swindon SN4 0AJ

| Today | See what it's worth now |
| 23 Mar 2026 | £560,000 |
| 27 Jul 2023 | £466,000 |
No other historical records.
17, New Road, Chiseldon, Swindon SN4 0LX
| Today | See what it's worth now |
| 23 Mar 2026 | £297,000 |
| 18 Jan 2019 | £227,000 |
45, Hallam Moor, Swindon SN3 6LS
| Today | See what it's worth now |
| 27 Feb 2026 | £222,500 |
| 29 Jun 2018 | £175,000 |
21, Brimble Hill, Wroughton, Swindon SN4 0RQ

| Today | See what it's worth now |
| 27 Feb 2026 | £308,000 |
| 28 Apr 2017 | £255,000 |
3, Coombe Close, Wroughton, Swindon SN4 0SB
| Today | See what it's worth now |
| 27 Feb 2026 | £290,000 |
| 4 Apr 2014 | £167,500 |
7, Lapwing Close, Covingham, Swindon SN3 5EB
| Today | See what it's worth now |
| 27 Feb 2026 | £215,000 |
| 17 Dec 2020 | £195,000 |
30, Mallard Close, Covingham, Swindon SN3 5JQ

| Today | See what it's worth now |
| 27 Feb 2026 | £245,000 |
| 26 May 2020 | £180,000 |
99, Ridge Nether Moor, Liden, Swindon SN3 6NE
| Today | See what it's worth now |
| 27 Feb 2026 | £275,000 |
No other historical records.
5, Dobbin Close, Covingham, Swindon SN3 5EN
| Today | See what it's worth now |
| 27 Feb 2026 | £300,000 |
| 19 Feb 2018 | £235,000 |
155, Homington Avenue, Swindon SN3 6FG
| Today | See what it's worth now |
| 25 Feb 2026 | £400,000 |
| 30 Jan 2019 | £359,995 |
No other historical records.
6, Beresford Close, Eldene, Swindon SN3 6BT
| Today | See what it's worth now |
| 23 Feb 2026 | £296,000 |
| 6 Jun 2016 | £225,000 |
Source Acknowledgement: © Crown copyright. England and Wales house price data is publicly available information produced by the HM Land Registry.This material was last updated on 9 July 2026. It covers the period from 1 January 1995 to 30 April 2026 and contains property transactions which have been registered during that period. Contains HM Land Registry data © Crown copyright and database right 2026. This data is licensed under the Open Government Licence v3.0.
Disclaimer: Rightmove.co.uk provides this HM Land Registry data "as is". The burden for fitness of the data relies completely with the user and is provided for informational purposes only. No warranty, express or implied, is given relating to the accuracy of content of the HM Land Registry data and Rightmove does not accept any liability for error or omission. If you have found an error with the data or need further information please contact HM Land Registry.
Permitted Use: Viewers of this Information are granted permission to access this Crown copyright material and to download it onto electronic, magnetic, optical or similar storage media provided that such activities are for private research, study or in-house use only. Any other use of the material requires the formal written permission of Land Registry which can be requested from us, and is subject to an additional licence and associated charge.
Rightmove takes no liability for your use of, or reliance on, Rightmove's Instant Valuation due to the limitations of our tracking tool listed here. Use of this tool is taken entirely at your own risk. All rights reserved.