
House Prices in M20
House prices in M20 have an overall average of £410,281 over the last year.
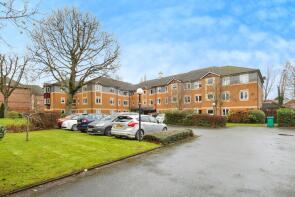
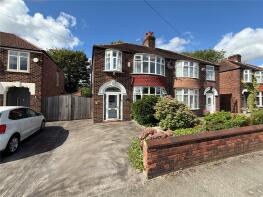
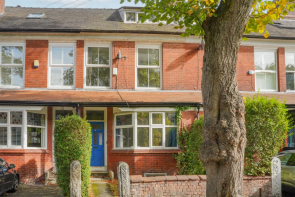
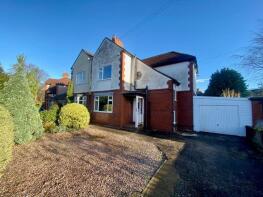
The majority of properties sold in M20 during the last year were flats, selling for an average price of £262,901. Semi-detached properties sold for an average of £485,788, with terraced properties fetching £450,142.
Overall, the historical sold prices in M20 over the last year were 2% up on the previous year and 5% up on the 2023 peak of £391,504.
Properties Sold
14, St Catherine's Road, Manchester M20 3EF
| Today | See what it's worth now |
| 20 Apr 2026 | £410,000 |
| 29 Jul 2022 | £340,000 |
Flat 2, 19b, Beaver Road, Manchester M20 6SR
| Today | See what it's worth now |
| 16 Apr 2026 | £199,950 |
| 14 Oct 2022 | £195,000 |
No other historical records.
Flat 10, 80 Copperways, Palatine Road, Manchester M20 3JZ
| Today | See what it's worth now |
| 15 Apr 2026 | £240,000 |
| 27 Oct 2015 | £148,000 |
Extensions and planning permission in M20
See planning approval stats, extension build costs and value added estimates.

25, Osborne Street, Didsbury, Manchester M20 2QZ
| Today | See what it's worth now |
| 10 Apr 2026 | £796,000 |
| 26 Sep 2014 | £442,500 |
59, Parrs Wood Avenue, Manchester M20 5NB
| Today | See what it's worth now |
| 10 Apr 2026 | £767,500 |
| 17 Sep 2020 | £583,500 |
13, Selsey Drive, Manchester M20 5WW

| Today | See what it's worth now |
| 10 Apr 2026 | £373,500 |
| 9 Dec 2016 | £223,000 |
30, Cresswell Grove, Manchester M20 2NH
| Today | See what it's worth now |
| 10 Apr 2026 | £775,000 |
| 12 Aug 2019 | £508,800 |
26, Parrs Wood Road, Manchester M20 4NJ
| Today | See what it's worth now |
| 10 Apr 2026 | £300,000 |
| 21 Sep 2007 | £225,000 |
No other historical records.
10, Ballbrook Court, Wilmslow Road, Manchester M20 3GT
| Today | See what it's worth now |
| 9 Apr 2026 | £270,000 |
| 26 Jul 1999 | £75,000 |
No other historical records.
Flat 18, 1 Souchay Court, Clothorn Road, Manchester M20 6BR
| Today | See what it's worth now |
| 7 Apr 2026 | £170,000 |
| 16 Oct 2015 | £140,000 |
Flat 5, 10 Weaver House, Barlow Moor Road, Manchester M20 6TR
| Today | See what it's worth now |
| 7 Apr 2026 | £282,500 |
| 20 Jul 2023 | £263,000 |
Flat 7, 2 Sandhurst House, Walkershall Way, Manchester M20 2HW

| Today | See what it's worth now |
| 2 Apr 2026 | £895,000 |
| 28 Feb 2017 | £625,000 |
No other historical records.
36, Houseman Crescent, Manchester M20 2JD
| Today | See what it's worth now |
| 2 Apr 2026 | £480,000 |
| 11 Dec 2009 | £300,000 |
No other historical records.
Flat 1, 39, Clyde Road, Manchester M20 2JJ
| Today | See what it's worth now |
| 2 Apr 2026 | £210,000 |
| 8 Apr 2020 | £166,500 |
Flat 5, Oak Court, Mauldeth Road, Manchester M20 4NE
| Today | See what it's worth now |
| 2 Apr 2026 | £70,000 |
| 3 Aug 2012 | £59,950 |
No other historical records.
41, Arnfield Road, Manchester M20 4AQ
| Today | See what it's worth now |
| 1 Apr 2026 | £384,000 |
| 16 Oct 2015 | £230,000 |
6, Bamford Road, Manchester M20 2GW
| Today | See what it's worth now |
| 1 Apr 2026 | £494,000 |
| 16 Mar 2001 | £163,000 |
No other historical records.
395, Parrs Wood Road, Manchester M20 5WA
| Today | See what it's worth now |
| 31 Mar 2026 | £462,000 |
| 22 Aug 2008 | £240,000 |
No other historical records.
9, Haldon Road, Manchester M20 4SY
| Today | See what it's worth now |
| 31 Mar 2026 | £267,000 |
| 19 Jun 2000 | £53,000 |
No other historical records.
10, Tunstead Avenue, Manchester M20 1JY
| Today | See what it's worth now |
| 31 Mar 2026 | £420,000 |
| 13 Mar 1998 | £58,000 |
No other historical records.
857, Kingsway, Manchester M20 5PA

| Today | See what it's worth now |
| 31 Mar 2026 | £360,000 |
| 13 Dec 2011 | £170,000 |
No other historical records.
12, Ballbrook Court, Wilmslow Road, Manchester M20 3GT
| Today | See what it's worth now |
| 27 Mar 2026 | £230,500 |
| 23 Oct 2015 | £174,500 |
70, Cavendish Road, Manchester M20 1QF
| Today | See what it's worth now |
| 27 Mar 2026 | £580,000 |
| 22 Oct 2020 | £470,000 |
Source Acknowledgement: © Crown copyright. England and Wales house price data is publicly available information produced by the HM Land Registry.This material was last updated on 9 July 2026. It covers the period from 1 January 1995 to 30 April 2026 and contains property transactions which have been registered during that period. Contains HM Land Registry data © Crown copyright and database right 2026. This data is licensed under the Open Government Licence v3.0.
Disclaimer: Rightmove.co.uk provides this HM Land Registry data "as is". The burden for fitness of the data relies completely with the user and is provided for informational purposes only. No warranty, express or implied, is given relating to the accuracy of content of the HM Land Registry data and Rightmove does not accept any liability for error or omission. If you have found an error with the data or need further information please contact HM Land Registry.
Permitted Use: Viewers of this Information are granted permission to access this Crown copyright material and to download it onto electronic, magnetic, optical or similar storage media provided that such activities are for private research, study or in-house use only. Any other use of the material requires the formal written permission of Land Registry which can be requested from us, and is subject to an additional licence and associated charge.
Rightmove takes no liability for your use of, or reliance on, Rightmove's Instant Valuation due to the limitations of our tracking tool listed here. Use of this tool is taken entirely at your own risk. All rights reserved.