
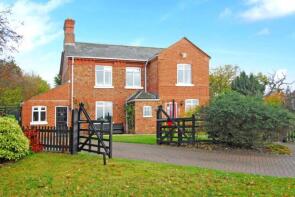
House Prices in Marsh Gibbon
House prices in Marsh Gibbon have an overall average of £900,000 over the last year.
Overall, the historical sold prices in Marsh Gibbon over the last year were 71% up on the previous year and 50% up on the 2022 peak of £601,406.
Properties Sold
Lawnside, Tompkins Lane, Bicester OX27 0EX


| Today | See what it's worth now |
| 31 Jul 2025 | £725,000 |
| 23 Sep 1998 | £161,000 |
No other historical records.
Crossfields, Whales Lane, Bicester OX27 0HB
| Today | See what it's worth now |
| 18 Jun 2025 | £800,000 |
| 11 Dec 2014 | £625,000 |
Moss Cottage, Castle Close, Bicester OX27 0HY
| Today | See what it's worth now |
| 4 Jun 2025 | £1,175,000 |
| 30 Sep 2010 | £725,000 |
29, Little Marsh Road, Bicester OX27 0AF
| Today | See what it's worth now |
| 28 Mar 2025 | £413,000 |
| 23 Mar 2007 | £225,000 |
27, Little Marsh Road, Bicester OX27 0AF

| Today | See what it's worth now |
| 21 Mar 2025 | £310,000 |
| 13 Mar 2020 | £282,000 |
4 Squirrels, Swan Lane, Bicester OX27 0HH
| Today | See what it's worth now |
| 11 Mar 2025 | £725,000 |
| 7 Aug 2000 | £260,000 |
May Cottage, Summerstown, Bicester OX27 0AW
| Today | See what it's worth now |
| 11 Mar 2025 | £692,000 |
| 3 Jun 2016 | £542,500 |
9 Geraden, Swan Lane, Bicester OX27 0HH

| Today | See what it's worth now |
| 11 Mar 2025 | £550,000 |
| 18 Jul 2014 | £375,000 |
No other historical records.
2, Ashbourne Cottages, Burnell Court, Bicester OX27 0GA
| Today | See what it's worth now |
| 11 Mar 2025 | £525,000 |
| 4 Apr 2019 | £400,000 |
18, Millfield Close, Marsh Gibbon OX27 0HR
| Today | See what it's worth now |
| 7 Mar 2025 | £313,000 |
No other historical records.
11, Jubilee Close, Marsh Gibbon OX27 0BA

| Today | See what it's worth now |
| 28 Feb 2025 | £475,000 |
No other historical records.
23, Rectory Close, Bicester OX27 0HT
| Today | See what it's worth now |
| 25 Feb 2025 | £540,000 |
| 11 Jul 2017 | £400,000 |
No other historical records.
19, Millfield Close, Bicester OX27 0HR

| Today | See what it's worth now |
| 20 Feb 2025 | £313,000 |
| 25 Aug 2017 | £290,000 |
43, Little Marsh Road, Bicester OX27 0AF

| Today | See what it's worth now |
| 3 Feb 2025 | £212,000 |
| 13 Sep 2001 | £87,950 |
19, Rectory Close, Marsh Gibbon OX27 0HT

| Today | See what it's worth now |
| 28 Nov 2024 | £420,000 |
No other historical records.
Fleur De Lys, West Edge, Marsh Gibbon OX27 0HA

| Today | See what it's worth now |
| 18 Sep 2024 | £1,050,000 |
No other historical records.
The Old Station, Marsh Gibbon Road, Poundon OX27 0AX
| Today | See what it's worth now |
| 30 Aug 2024 | £510,000 |
No other historical records.
5, Jubilee Close, Marsh Gibbon OX27 0BA

| Today | See what it's worth now |
| 27 Aug 2024 | £415,000 |
No other historical records.
10, Jubilee Close, Marsh Gibbon OX27 0BA

| Today | See what it's worth now |
| 24 Jul 2024 | £367,500 |
No other historical records.
Swan Farm, Castle Street, Bicester OX27 0HJ

| Today | See what it's worth now |
| 5 Jul 2024 | £1,400,000 |
| 1 Apr 1996 | £260,000 |
2, Styles Close, Bicester OX27 0ER

| Today | See what it's worth now |
| 27 Jun 2024 | £450,000 |
| 12 Feb 1999 | £121,000 |
No other historical records.
9, Jubilee Close, Marsh Gibbon OX27 0BA

| Today | See what it's worth now |
| 14 Jun 2024 | £360,000 |
No other historical records.
2, West Edge Cottage, West Edge, Bicester OX27 0HA

| Today | See what it's worth now |
| 12 Jun 2024 | £735,000 |
| 25 Mar 2014 | £450,000 |
No other historical records.
Sunnymeade, The College, Bicester OX27 0HW

| Today | See what it's worth now |
| 31 May 2024 | £383,000 |
| 1 Jun 2018 | £295,000 |
6, Jubilee Close, Marsh Gibbon OX27 0BA

| Today | See what it's worth now |
| 28 May 2024 | £425,000 |
No other historical records.
Source Acknowledgement: © Crown copyright. England and Wales house price data is publicly available information produced by the HM Land Registry.This material was last updated on 4 February 2026. It covers the period from 1 January 1995 to 24 December 2025 and contains property transactions which have been registered during that period. Contains HM Land Registry data © Crown copyright and database right 2026. This data is licensed under the Open Government Licence v3.0.
Disclaimer: Rightmove.co.uk provides this HM Land Registry data "as is". The burden for fitness of the data relies completely with the user and is provided for informational purposes only. No warranty, express or implied, is given relating to the accuracy of content of the HM Land Registry data and Rightmove does not accept any liability for error or omission. If you have found an error with the data or need further information please contact HM Land Registry.
Permitted Use: Viewers of this Information are granted permission to access this Crown copyright material and to download it onto electronic, magnetic, optical or similar storage media provided that such activities are for private research, study or in-house use only. Any other use of the material requires the formal written permission of Land Registry which can be requested from us, and is subject to an additional licence and associated charge.
Map data ©OpenStreetMap contributors.
Rightmove takes no liability for your use of, or reliance on, Rightmove's Instant Valuation due to the limitations of our tracking tool listed here. Use of this tool is taken entirely at your own risk. All rights reserved.