
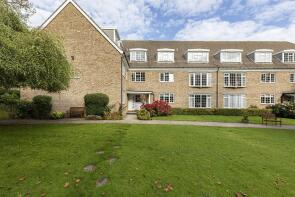
House Prices in Marsh
House prices in Marsh have an overall average of £208,089 over the last year.
The majority of properties sold in Marsh during the last year were terraced properties, selling for an average price of £165,041. Semi-detached properties sold for an average of £267,464, with detached properties fetching £443,750.
Overall, the historical sold prices in Marsh over the last year were similar to the previous year and 7% up on the 2023 peak of £193,777.
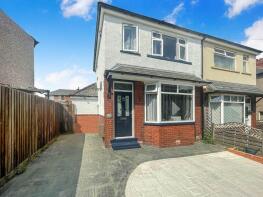
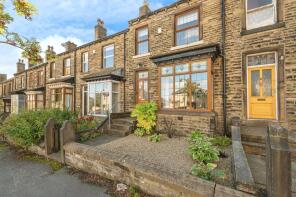
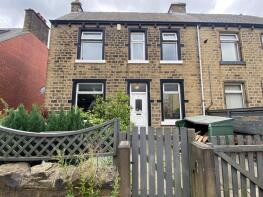
Properties Sold
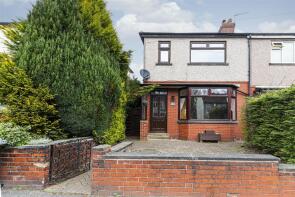
10, Arncliffe Court, Marsh, Huddersfield HD1 4PT
| Today | See what it's worth now |
| 27 Mar 2026 | £230,000 |
| 31 May 2019 | £142,500 |
34, Rumbold Road, Edgerton, Huddersfield HD3 3DB

| Today | See what it's worth now |
| 19 Mar 2026 | £420,000 |
| 16 Jul 2015 | £306,000 |
42, Rose Avenue, Marsh, Huddersfield HD3 4BL
| Today | See what it's worth now |
| 5 Mar 2026 | £228,000 |
| 5 Jul 2019 | £143,000 |
18, Thornhill Avenue, Lindley, Huddersfield HD3 3DR
| Today | See what it's worth now |
| 27 Feb 2026 | £246,000 |
| 3 Dec 2004 | £115,000 |
No other historical records.
4, Savile Road, Lindley, Huddersfield HD3 3DH
| Today | See what it's worth now |
| 20 Feb 2026 | £141,000 |
| 8 Sep 2006 | £124,000 |
3a, Syringa Street, Marsh, Huddersfield HD1 4PD
| Today | See what it's worth now |
| 16 Feb 2026 | £120,000 |
| 16 Jan 2003 | £70,000 |
No other historical records.
36, Imperial Road, Edgerton, Huddersfield HD1 4PJ
| Today | See what it's worth now |
| 13 Feb 2026 | £330,000 |
| 3 May 2013 | £180,000 |
No other historical records.
8, Wellington Street, Oakes, Huddersfield HD3 3HA
| Today | See what it's worth now |
| 6 Feb 2026 | £175,000 |
| 3 Feb 2000 | £29,000 |
No other historical records.
17, Grasscroft Road, Marsh, Huddersfield HD1 4LP
| Today | See what it's worth now |
| 30 Jan 2026 | £159,950 |
| 30 Jan 2026 | £159,950 |
16, Wyvern Avenue, Marsh, Huddersfield HD3 4BH
| Today | See what it's worth now |
| 30 Jan 2026 | £420,000 |
| 30 Oct 2000 | £119,950 |
No other historical records.
137, Luck Lane, Paddock, Huddersfield HD1 4QZ
| Today | See what it's worth now |
| 16 Jan 2026 | £308,000 |
| 7 Feb 2019 | £205,000 |
63, St James's Road, Marsh, Huddersfield HD1 4QA
| Today | See what it's worth now |
| 19 Dec 2025 | £150,000 |
| 14 Dec 2006 | £116,500 |
3, Gibson Street, Oakes, Huddersfield HD3 3HB
| Today | See what it's worth now |
| 18 Dec 2025 | £180,000 |
| 23 Jul 2021 | £160,000 |
13, Syringa Street, Marsh, Huddersfield HD1 4PD
| Today | See what it's worth now |
| 18 Dec 2025 | £184,000 |
| 12 Oct 2006 | £139,950 |
26, Rose Avenue, Marsh, Huddersfield HD3 4BL
| Today | See what it's worth now |
| 12 Dec 2025 | £198,000 |
| 17 Aug 1998 | £51,000 |
No other historical records.
15, Syringa Street, Marsh, Huddersfield HD1 4PD
| Today | See what it's worth now |
| 2 Dec 2025 | £222,500 |
| 2 Dec 2025 | £222,500 |
29, Dudley Road, Marsh, Huddersfield HD1 4LZ
| Today | See what it's worth now |
| 1 Dec 2025 | £112,000 |
| 28 Feb 1997 | £42,500 |
85, Wellington Street, Oakes, Huddersfield HD3 3EY
| Today | See what it's worth now |
| 28 Nov 2025 | £135,000 |
| 18 Feb 2022 | £127,000 |
90, Broomfield Road, Marsh, Huddersfield HD1 4QD
| Today | See what it's worth now |
| 28 Nov 2025 | £110,000 |
| 2 Jun 2008 | £90,000 |
No other historical records.
51, Wellfield Road, Marsh, Huddersfield HD3 4BJ
| Today | See what it's worth now |
| 28 Nov 2025 | £183,000 |
| 25 Aug 2006 | £140,000 |
33, Forrest Avenue, Marsh, Huddersfield HD1 4PL
| Today | See what it's worth now |
| 28 Nov 2025 | £255,000 |
| 13 Jul 2018 | £190,000 |
No other historical records.
67, Reed Street, Marsh, Huddersfield HD3 4AA
| Today | See what it's worth now |
| 28 Nov 2025 | £116,419 |
| 5 Sep 2013 | £100,000 |
No other historical records.
37, Acre Street, Lindley, Huddersfield HD3 3DZ
| Today | See what it's worth now |
| 24 Nov 2025 | £189,000 |
| 20 Apr 2018 | £126,000 |
No other historical records.
Source Acknowledgement: © Crown copyright. England and Wales house price data is publicly available information produced by the HM Land Registry.This material was last updated on 9 July 2026. It covers the period from 1 January 1995 to 30 April 2026 and contains property transactions which have been registered during that period. Contains HM Land Registry data © Crown copyright and database right 2026. This data is licensed under the Open Government Licence v3.0.
Disclaimer: Rightmove.co.uk provides this HM Land Registry data "as is". The burden for fitness of the data relies completely with the user and is provided for informational purposes only. No warranty, express or implied, is given relating to the accuracy of content of the HM Land Registry data and Rightmove does not accept any liability for error or omission. If you have found an error with the data or need further information please contact HM Land Registry.
Permitted Use: Viewers of this Information are granted permission to access this Crown copyright material and to download it onto electronic, magnetic, optical or similar storage media provided that such activities are for private research, study or in-house use only. Any other use of the material requires the formal written permission of Land Registry which can be requested from us, and is subject to an additional licence and associated charge.
Rightmove takes no liability for your use of, or reliance on, Rightmove's Instant Valuation due to the limitations of our tracking tool listed here. Use of this tool is taken entirely at your own risk. All rights reserved.