
House Prices in Mawnan Smith
House prices in Mawnan Smith have an overall average of £638,123 over the last year.
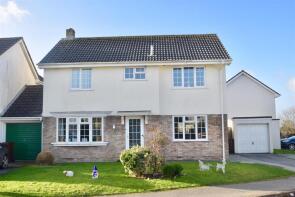
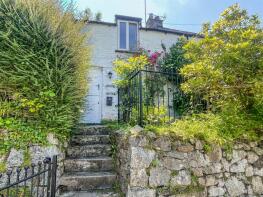
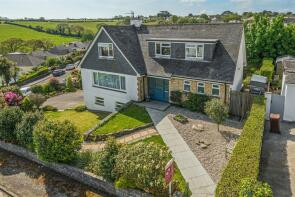
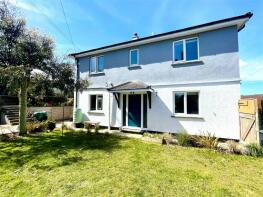
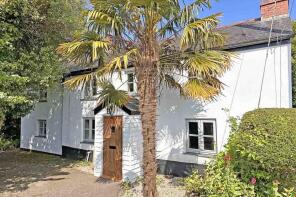
The majority of properties sold in Mawnan Smith during the last year were detached properties, selling for an average price of £706,501. Semi-detached properties sold for an average of £370,100, with terraced properties fetching £427,500.
Overall, the historical sold prices in Mawnan Smith over the last year were 11% down on the previous year and 15% down on the 2022 peak of £748,999.
Properties Sold
45, Shute Hill, Falmouth TR11 5HQ
| Today | See what it's worth now |
| 5 Dec 2025 | £427,500 |
| 31 Jan 2011 | £240,000 |
No other historical records.
Chall Barn, Higher Tregarne Farm, Road From Penwarne Road To Tregarne House, Falmouth TR11 5JW


| Today | See what it's worth now |
| 2 Dec 2025 | £410,000 |
No other historical records.
Tremethick, Budock Vean Lane, Mawnan Smith TR11 5LH
| Today | See what it's worth now |
| 31 Jul 2025 | £1,025,000 |
No other historical records.
9 Tremay, Chapel Town Close, Falmouth TR11 5UU
| Today | See what it's worth now |
| 30 Jul 2025 | £446,500 |
| 21 Feb 2020 | £295,000 |
Amanyl, Penwarne Road, Falmouth TR11 5PQ
| Today | See what it's worth now |
| 6 Jun 2025 | £630,000 |
| 30 Aug 2024 | £650,000 |
Highfields, Grove Hill, Falmouth TR11 5ER
| Today | See what it's worth now |
| 31 Mar 2025 | £565,000 |
| 23 Jan 2013 | £370,000 |
No other historical records.
Treveal, Grove Hill, Falmouth TR11 5ER

| Today | See what it's worth now |
| 19 Mar 2025 | £1,120,000 |
| 9 Mar 2018 | £870,000 |
No other historical records.
Tida Apa, Carlidnack Road, Falmouth TR11 5HA
| Today | See what it's worth now |
| 17 Mar 2025 | £370,100 |
| 9 Jun 2011 | £280,000 |
Court Cottage, Trehunsey Close, Falmouth TR11 5HW
| Today | See what it's worth now |
| 7 Mar 2025 | £749,007 |
| 19 Jan 2017 | £496,000 |
No other historical records.
7 Dowren, Shute Hill, Falmouth TR11 5HQ
| Today | See what it's worth now |
| 21 Feb 2025 | £525,000 |
| 7 Oct 2011 | £272,000 |
4, The Square, Falmouth TR11 5EP
| Today | See what it's worth now |
| 18 Feb 2025 | £285,000 |
| 7 Sep 2012 | £164,000 |
No other historical records.
1, Carlidnack Road, Mawnan Smith TR11 5HA
| Today | See what it's worth now |
| 14 Feb 2025 | £350,000 |
No other historical records.
Skerries Bank, Budock Vean Lane, Falmouth TR11 5LH
| Today | See what it's worth now |
| 17 Jan 2025 | £960,000 |
| 11 Oct 2007 | £550,000 |
No other historical records.
Polvadhi, Bar Road, Helford Passage Hill, Falmouth TR11 5LF

| Today | See what it's worth now |
| 21 Nov 2024 | £1,525,000 |
| 12 Sep 2014 | £670,000 |
No other historical records.
16, Parc An Manns, Falmouth TR11 5EU
| Today | See what it's worth now |
| 18 Nov 2024 | £385,000 |
| 9 Aug 2019 | £220,000 |
No other historical records.
Trebah Wartha, Mawnan Smith TR11 5JZ

| Today | See what it's worth now |
| 18 Nov 2024 | £675,000 |
No other historical records.
Jasmin Cottage, Bareppa, Budock Water, Mawnan Smith TR11 5EG
| Today | See what it's worth now |
| 7 Nov 2024 | £230,000 |
| 9 Aug 1996 | £48,350 |
No other historical records.
27, Castle View Park, Falmouth TR11 5HB
| Today | See what it's worth now |
| 31 Oct 2024 | £865,000 |
| 4 Nov 2014 | £395,000 |
2, Close Cottages, Trehunsey Close, Mawnan Smith, Mawnan TR11 5HX

| Today | See what it's worth now |
| 14 Oct 2024 | £395,000 |
No other historical records.
Deira House, Carlidnack Road, Falmouth TR11 5HD
| Today | See what it's worth now |
| 11 Oct 2024 | £575,000 |
| 10 Nov 2020 | £435,000 |
Tregarland, Carlidnack Road, Mawnan Smith TR11 5HD

| Today | See what it's worth now |
| 11 Oct 2024 | £490,000 |
No other historical records.
Honeysuckle Cottage, The Square, Mawnan Smith TR11 5EP
| Today | See what it's worth now |
| 30 Sep 2024 | £560,000 |
| 1 Jul 1999 | £100,000 |
No other historical records.
34, Shute Hill, Falmouth TR11 5HQ
| Today | See what it's worth now |
| 26 Sep 2024 | £565,000 |
| 9 Apr 1998 | £105,000 |
3, Chapel Town Close, Mawnan Smith TR11 5UU
| Today | See what it's worth now |
| 17 Sep 2024 | £500,000 |
No other historical records.
Trerose Cottage, Old Church Road, Falmouth TR11 5HY

| Today | See what it's worth now |
| 6 Sep 2024 | £747,000 |
| 10 Aug 2017 | £695,000 |
No other historical records.
Source Acknowledgement: © Crown copyright. England and Wales house price data is publicly available information produced by the HM Land Registry.This material was last updated on 4 February 2026. It covers the period from 1 January 1995 to 24 December 2025 and contains property transactions which have been registered during that period. Contains HM Land Registry data © Crown copyright and database right 2026. This data is licensed under the Open Government Licence v3.0.
Disclaimer: Rightmove.co.uk provides this HM Land Registry data "as is". The burden for fitness of the data relies completely with the user and is provided for informational purposes only. No warranty, express or implied, is given relating to the accuracy of content of the HM Land Registry data and Rightmove does not accept any liability for error or omission. If you have found an error with the data or need further information please contact HM Land Registry.
Permitted Use: Viewers of this Information are granted permission to access this Crown copyright material and to download it onto electronic, magnetic, optical or similar storage media provided that such activities are for private research, study or in-house use only. Any other use of the material requires the formal written permission of Land Registry which can be requested from us, and is subject to an additional licence and associated charge.
Map data ©OpenStreetMap contributors.
Rightmove takes no liability for your use of, or reliance on, Rightmove's Instant Valuation due to the limitations of our tracking tool listed here. Use of this tool is taken entirely at your own risk. All rights reserved.