
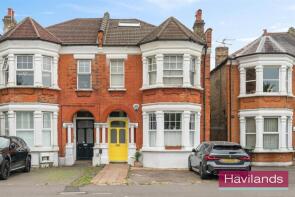
House Prices in N21
House prices in N21 have an overall average of £728,043 over the last year.
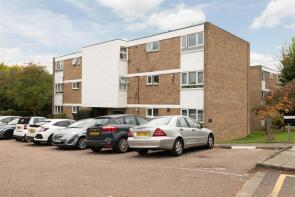
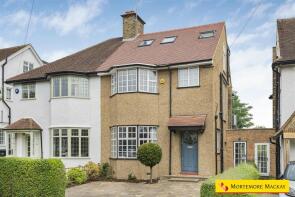
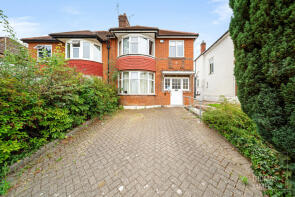
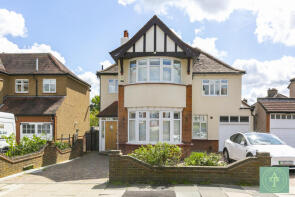
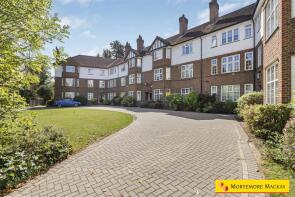
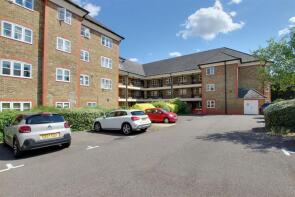
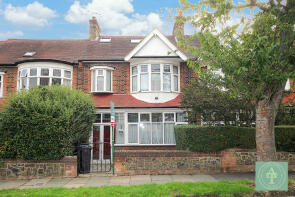
The majority of properties sold in N21 during the last year were flats, selling for an average price of £358,409. Semi-detached properties sold for an average of £921,953, with terraced properties fetching £716,486.
Overall, the historical sold prices in N21 over the last year were similar to the previous year and 3% down on the 2023 peak of £754,016.
Properties Sold
3, 50 Oak Lodge, Eversley Park Road, London N21 1JL
| Today | See what it's worth now |
| 24 Apr 2026 | £130,000 |
| 11 Jun 2021 | £272,500 |
No other historical records.
14, Merridene, London N21 1RD
| Today | See what it's worth now |
| 23 Apr 2026 | £320,000 |
| 22 Apr 2022 | £330,000 |
10, Sherbrook Gardens, London N21 2NU
| Today | See what it's worth now |
| 17 Apr 2026 | £930,000 |
| 9 Aug 2013 | £490,000 |
No other historical records.
Extensions and planning permission in N21
See planning approval stats, extension build costs and value added estimates.

22, Church Hill, London N21 1JA
| Today | See what it's worth now |
| 8 Apr 2026 | £867,000 |
| 31 May 2002 | £325,000 |
No other historical records.
60, Merridene, London N21 1RD

| Today | See what it's worth now |
| 1 Apr 2026 | £690,500 |
| 25 May 2001 | £310,000 |
39, Duncan Court, Green Lanes, London N21 3RL
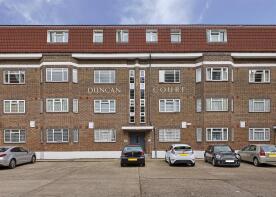
| Today | See what it's worth now |
| 1 Apr 2026 | £245,000 |
| 8 Feb 2021 | £262,000 |
11, Highfield Road, London N21 3HD
| Today | See what it's worth now |
| 27 Mar 2026 | £525,000 |
| 17 Feb 2012 | £262,000 |
18b, Orpington Road, London N21 3PG

| Today | See what it's worth now |
| 27 Mar 2026 | £385,000 |
| 18 Oct 2019 | £353,000 |
5, Eversley Park Road, London N21 1JD
| Today | See what it's worth now |
| 20 Mar 2026 | £500,000 |
| 8 Nov 2019 | £440,000 |
7, Stratfield Park Close, London N21 1BU
| Today | See what it's worth now |
| 20 Mar 2026 | £635,000 |
| 23 Jun 2004 | £305,000 |
No other historical records.
14, Blackwell Close, London N21 1UL

| Today | See what it's worth now |
| 13 Mar 2026 | £347,000 |
| 22 Aug 2014 | £295,000 |
10, Rowantree Close, Southgate N21 3EE
| Today | See what it's worth now |
| 12 Mar 2026 | £570,000 |
No other historical records.
194, Hoppers Road, London N21 3JX
| Today | See what it's worth now |
| 6 Mar 2026 | £565,000 |
| 16 May 2023 | £550,000 |
Flat 26, 205 Austen Court, Winchmore Hill Road, London N21 1QN
| Today | See what it's worth now |
| 2 Mar 2026 | £130,000 |
| 15 Jul 2010 | £238,950 |
123, Pennington Drive, London N21 1TN
| Today | See what it's worth now |
| 26 Feb 2026 | £267,500 |
| 19 Feb 2014 | £206,000 |
2, Brooklands Court, Bush Hill, London N21 2BZ
| Today | See what it's worth now |
| 20 Feb 2026 | £465,000 |
| 7 Dec 2012 | £295,000 |
9, 1 Belvedere Court, Paulin Drive, London N21 1AZ
| Today | See what it's worth now |
| 20 Feb 2026 | £600,000 |
| 4 May 2001 | £325,000 |
No other historical records.
17, Moynihan Drive, London N21 1SH
| Today | See what it's worth now |
| 19 Feb 2026 | £605,000 |
| 3 Oct 2016 | £530,000 |
77, Hyde Park Avenue, Southgate N21 2PL
| Today | See what it's worth now |
| 16 Feb 2026 | £613,000 |
No other historical records.
13, Hill House Close, London N21 1LG

| Today | See what it's worth now |
| 6 Feb 2026 | £517,500 |
| 11 Dec 2020 | £492,000 |
45, Oakwood Crescent, Southgate N21 1NX
| Today | See what it's worth now |
| 6 Feb 2026 | £755,000 |
No other historical records.
4, Myddelton Gardens, London N21 2PA
| Today | See what it's worth now |
| 2 Feb 2026 | £1,250,000 |
| 16 Feb 2007 | £530,000 |
1, Uplands Court, The Green, London N21 1LD
| Today | See what it's worth now |
| 30 Jan 2026 | £475,000 |
| 20 Dec 1996 | £79,000 |
No other historical records.
Source Acknowledgement: © Crown copyright. England and Wales house price data is publicly available information produced by the HM Land Registry.This material was last updated on 9 July 2026. It covers the period from 1 January 1995 to 30 April 2026 and contains property transactions which have been registered during that period. Contains HM Land Registry data © Crown copyright and database right 2026. This data is licensed under the Open Government Licence v3.0.
Disclaimer: Rightmove.co.uk provides this HM Land Registry data "as is". The burden for fitness of the data relies completely with the user and is provided for informational purposes only. No warranty, express or implied, is given relating to the accuracy of content of the HM Land Registry data and Rightmove does not accept any liability for error or omission. If you have found an error with the data or need further information please contact HM Land Registry.
Permitted Use: Viewers of this Information are granted permission to access this Crown copyright material and to download it onto electronic, magnetic, optical or similar storage media provided that such activities are for private research, study or in-house use only. Any other use of the material requires the formal written permission of Land Registry which can be requested from us, and is subject to an additional licence and associated charge.
Rightmove takes no liability for your use of, or reliance on, Rightmove's Instant Valuation due to the limitations of our tracking tool listed here. Use of this tool is taken entirely at your own risk. All rights reserved.