
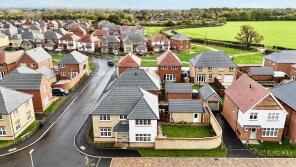
House Prices in Nantwich
House prices in Nantwich have an overall average of £312,862 over the last year.
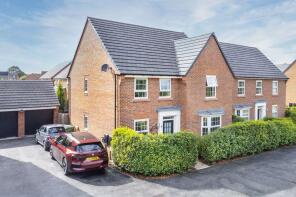
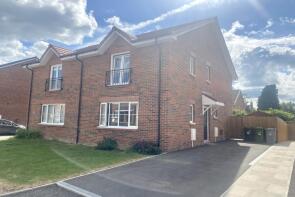
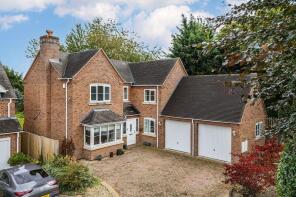
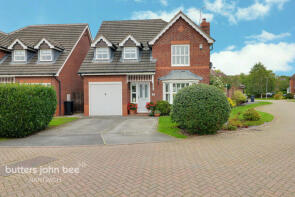
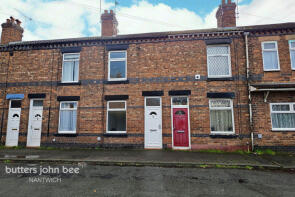
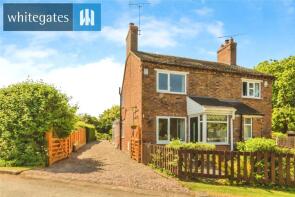
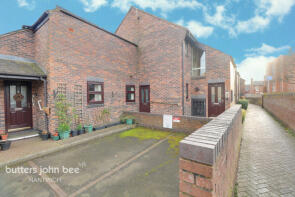
The majority of properties sold in Nantwich during the last year were detached properties, selling for an average price of £450,300. Semi-detached properties sold for an average of £266,148, with terraced properties fetching £243,738.
Overall, the historical sold prices in Nantwich over the last year were 3% up on the previous year and 2% up on the 2023 peak of £307,422.
Properties Sold
27, Montgomery Avenue, Nantwich CW5 6YJ
| Today | See what it's worth now |
| 23 Apr 2026 | £360,000 |
| 16 Oct 2020 | £280,000 |
10, Holly Drive, Nantwich CW5 5TY
| Today | See what it's worth now |
| 17 Apr 2026 | £270,000 |
| 18 Jul 2022 | £260,000 |
68, Reaseheath Way, Nantwich CW5 6XF
| Today | See what it's worth now |
| 17 Apr 2026 | £368,000 |
| 7 Jun 2019 | £282,995 |
No other historical records.
30, Byron Walk, Nantwich CW5 5UT
| Today | See what it's worth now |
| 13 Apr 2026 | £210,000 |
| 25 Jun 2004 | £124,995 |
No other historical records.
10, White Iris Place, Nantwich CW5 7TB
| Today | See what it's worth now |
| 10 Apr 2026 | £460,000 |
| 7 Feb 2020 | £376,995 |
No other historical records.
15, Cubitt Close, Nantwich CW5 6SY
| Today | See what it's worth now |
| 2 Apr 2026 | £250,000 |
| 26 Jun 2020 | £226,950 |
No other historical records.
23, London Road, Nantwich CW5 7JL
| Today | See what it's worth now |
| 2 Apr 2026 | £81,500 |
| 15 Aug 2024 | £380,000 |
29, Birchin Lane, Nantwich CW5 6JU
| Today | See what it's worth now |
| 2 Apr 2026 | £535,000 |
| 8 Mar 2013 | £200,000 |
No other historical records.
Rose Cottage, Sound Lane, Nantwich CW5 8PS
| Today | See what it's worth now |
| 2 Apr 2026 | £185,000 |
| 17 Aug 2018 | £162,250 |
7, Orchard Street, Nantwich CW5 6QW
| Today | See what it's worth now |
| 2 Apr 2026 | £175,000 |
| 7 Nov 2022 | £149,000 |
33, Park View, Nantwich CW5 6EP
| Today | See what it's worth now |
| 2 Apr 2026 | £300,000 |
| 14 Jun 2021 | £260,000 |
24, Pollard Drive, Nantwich CW5 7EQ
| Today | See what it's worth now |
| 31 Mar 2026 | £635,000 |
| 28 May 2021 | £498,000 |
72, Coppice Road, Nantwich CW5 6QD
| Today | See what it's worth now |
| 30 Mar 2026 | £282,000 |
| 3 Dec 2010 | £155,000 |
No other historical records.
13, Torrington Close, Henhull CW5 6YB
| Today | See what it's worth now |
| 27 Mar 2026 | £445,000 |
| 18 Dec 2024 | £433,000 |
Flat 36, Mill House, Queens Drive, Nantwich CW5 5BX
| Today | See what it's worth now |
| 27 Mar 2026 | £105,000 |
| 25 Apr 2016 | £80,000 |
49, Tyldesley Way, Nantwich CW5 5UE

| Today | See what it's worth now |
| 26 Mar 2026 | £118,000 |
| 30 Jun 2005 | £146,750 |
No other historical records.
Hollyhock, Wybunbury Road, Nantwich CW5 7ER
| Today | See what it's worth now |
| 26 Mar 2026 | £565,000 |
| 14 Dec 2006 | £425,000 |
No other historical records.
10, Sutton Close, Nantwich CW5 5GF
| Today | See what it's worth now |
| 25 Mar 2026 | £135,000 |
| 4 Mar 2021 | £123,500 |
10, Monck Drive, Nantwich CW5 5UP
| Today | See what it's worth now |
| 24 Mar 2026 | £245,000 |
| 28 Aug 2020 | £205,000 |
5, Tinkersfield, Nantwich CW5 7GY
| Today | See what it's worth now |
| 24 Mar 2026 | £365,000 |
| 26 Nov 1999 | £114,950 |
No other historical records.
71, Jackson Avenue, Nantwich CW5 6LL

| Today | See what it's worth now |
| 24 Mar 2026 | £240,000 |
| 4 Aug 2017 | £215,000 |
8, Richmond Village, St Josephs Way, Nantwich CW5 6TD

| Today | See what it's worth now |
| 23 Mar 2026 | £166,000 |
| 1 Mar 2019 | £180,000 |
6, Albert Street, Nantwich CW5 5QD
| Today | See what it's worth now |
| 20 Mar 2026 | £145,000 |
| 10 Jul 2003 | £67,000 |
No other historical records.
Source Acknowledgement: © Crown copyright. England and Wales house price data is publicly available information produced by the HM Land Registry.This material was last updated on 9 July 2026. It covers the period from 1 January 1995 to 30 April 2026 and contains property transactions which have been registered during that period. Contains HM Land Registry data © Crown copyright and database right 2026. This data is licensed under the Open Government Licence v3.0.
Disclaimer: Rightmove.co.uk provides this HM Land Registry data "as is". The burden for fitness of the data relies completely with the user and is provided for informational purposes only. No warranty, express or implied, is given relating to the accuracy of content of the HM Land Registry data and Rightmove does not accept any liability for error or omission. If you have found an error with the data or need further information please contact HM Land Registry.
Permitted Use: Viewers of this Information are granted permission to access this Crown copyright material and to download it onto electronic, magnetic, optical or similar storage media provided that such activities are for private research, study or in-house use only. Any other use of the material requires the formal written permission of Land Registry which can be requested from us, and is subject to an additional licence and associated charge.
Rightmove takes no liability for your use of, or reliance on, Rightmove's Instant Valuation due to the limitations of our tracking tool listed here. Use of this tool is taken entirely at your own risk. All rights reserved.