
House Prices in Northop
House prices in Northop have an overall average of £284,076 over the last year.
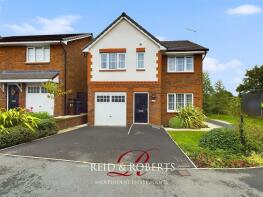
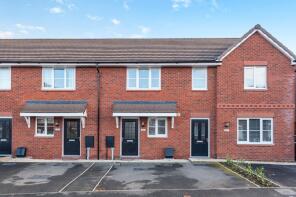
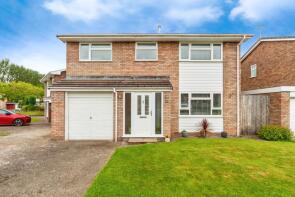
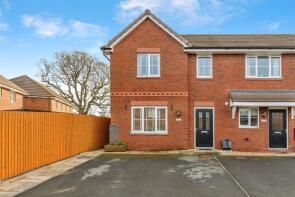
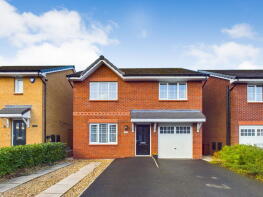
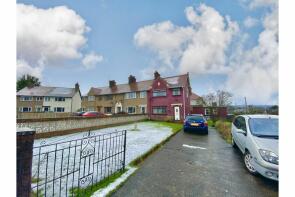
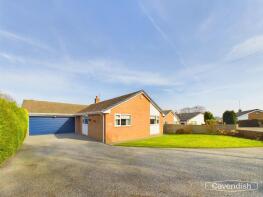
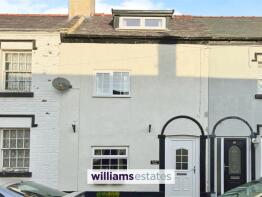
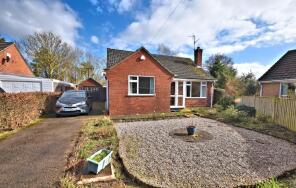
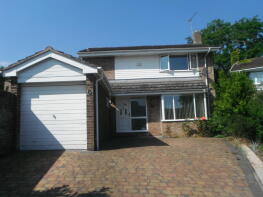
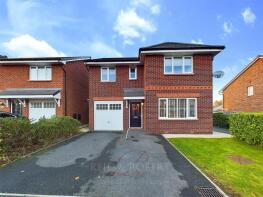
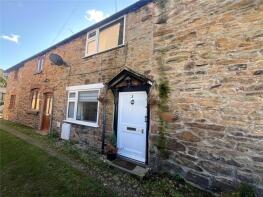
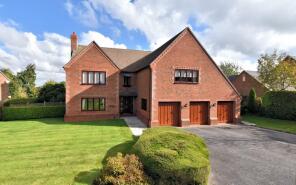
The majority of properties sold in Northop during the last year were detached properties, selling for an average price of £329,500. Terraced properties sold for an average of £202,560, with semi-detached properties fetching £192,000.
Overall, the historical sold prices in Northop over the last year were 10% down on the previous year and 17% down on the 2023 peak of £343,167.
Properties Sold
14, Plas Pen Y Glyn, Flint CH6 5BN

| Today | See what it's worth now |
| 15 Dec 2025 | £380,000 |
| 7 Jan 2016 | £276,000 |
No other historical records.
Chapel House, Y Waen, Flint CH6 5QR


| Today | See what it's worth now |
| 10 Oct 2025 | £192,000 |
| 8 Jan 2024 | £182,000 |
No other historical records.
5, Oak Drive, Mold CH7 6WH
| Today | See what it's worth now |
| 8 Oct 2025 | £305,000 |
| 14 Dec 2018 | £249,950 |
No other historical records.
20, Fox Field, Mold CH7 6GQ

| Today | See what it's worth now |
| 29 Aug 2025 | £157,500 |
| 23 May 2014 | £285,000 |
14, Ash Road, Mold CH7 6WN
| Today | See what it's worth now |
| 23 Jul 2025 | £210,000 |
| 12 Oct 2018 | £174,950 |
No other historical records.
93, St Peters Park, Mold CH7 6YU
| Today | See what it's worth now |
| 22 Jul 2025 | £350,000 |
| 21 Mar 2017 | £225,000 |
No other historical records.
18, Ash Road, Mold CH7 6WN
| Today | See what it's worth now |
| 18 Jul 2025 | £236,000 |
| 5 Oct 2018 | £189,950 |
No other historical records.
17, Ash Road, Mold CH7 6WN
| Today | See what it's worth now |
| 18 Jul 2025 | £350,000 |
| 7 Jun 2019 | £289,950 |
No other historical records.
Minafon, High Street, Mold CH7 6BQ

| Today | See what it's worth now |
| 6 Jun 2025 | £465,000 |
| 14 Nov 2008 | £280,000 |
3, Aber Crescent, Northop CH7 6DB
| Today | See what it's worth now |
| 6 Jun 2025 | £215,000 |
| 28 Jun 2024 | £157,500 |
No other historical records.
2, Lawnt Y Pentre, Flint CH6 5UN
| Today | See what it's worth now |
| 29 May 2025 | £390,000 |
| 15 Dec 2016 | £250,000 |
4, Village Close, Flint CH6 5WA

| Today | See what it's worth now |
| 16 May 2025 | £370,000 |
| 22 Feb 2012 | £247,500 |
No other historical records.
1, Glyndwr House, High Street, Mold CH7 6BH
| Today | See what it's worth now |
| 14 May 2025 | £192,000 |
| 29 Mar 2022 | £172,500 |
22, Park View, Northop CH7 6DD
| Today | See what it's worth now |
| 29 Apr 2025 | £220,000 |
No other historical records.
96, St Peters Park, Mold CH7 6YU
| Today | See what it's worth now |
| 11 Apr 2025 | £300,000 |
| 7 Sep 2007 | £243,500 |
19, Ash Road, Mold CH7 6WN
| Today | See what it's worth now |
| 1 Apr 2025 | £337,000 |
| 17 May 2019 | £294,950 |
No other historical records.
2, Yacht Terrace, High Street, Mold CH7 6BQ
| Today | See what it's worth now |
| 6 Mar 2025 | £159,800 |
| 14 Oct 2003 | £80,000 |
Western Gailes, Northop Country Park, Northop Country Park Estate Roads, Northop CH7 6WD
| Today | See what it's worth now |
| 20 Feb 2025 | £580,000 |
| 6 Feb 1997 | £229,500 |
No other historical records.
1, Pentre Terrace, Pentre Hill, Flint Mountain CH6 5QW
| Today | See what it's worth now |
| 10 Feb 2025 | £130,000 |
No other historical records.
13, Bryn Eglwys, Flint CH6 5SN

| Today | See what it's worth now |
| 6 Dec 2024 | £517,500 |
| 17 Nov 2005 | £291,000 |
No other historical records.
Appleton House, Starkey Lane, Mold CH7 6DG
| Today | See what it's worth now |
| 6 Dec 2024 | £787,000 |
| 31 Oct 2023 | £807,500 |
No other historical records.
10, Bryn Rhyd, Mold CH7 6EH
| Today | See what it's worth now |
| 6 Dec 2024 | £645,000 |
| 14 Apr 2000 | £190,000 |
No other historical records.
Smithy House, Flint Mountain CH6 5QT
| Today | See what it's worth now |
| 6 Dec 2024 | £390,000 |
No other historical records.
69, St Peters Park, Mold CH7 6DS

| Today | See what it's worth now |
| 26 Nov 2024 | £380,000 |
| 24 Nov 2014 | £225,000 |
No other historical records.
Sycamore Cottage, Northop Road, Flint Mountain CH6 5QG

| Today | See what it's worth now |
| 29 Oct 2024 | £123,333 |
No other historical records.
Source Acknowledgement: © Crown copyright. England and Wales house price data is publicly available information produced by the HM Land Registry.This material was last updated on 4 February 2026. It covers the period from 1 January 1995 to 24 December 2025 and contains property transactions which have been registered during that period. Contains HM Land Registry data © Crown copyright and database right 2026. This data is licensed under the Open Government Licence v3.0.
Disclaimer: Rightmove.co.uk provides this HM Land Registry data "as is". The burden for fitness of the data relies completely with the user and is provided for informational purposes only. No warranty, express or implied, is given relating to the accuracy of content of the HM Land Registry data and Rightmove does not accept any liability for error or omission. If you have found an error with the data or need further information please contact HM Land Registry.
Permitted Use: Viewers of this Information are granted permission to access this Crown copyright material and to download it onto electronic, magnetic, optical or similar storage media provided that such activities are for private research, study or in-house use only. Any other use of the material requires the formal written permission of Land Registry which can be requested from us, and is subject to an additional licence and associated charge.
Map data ©OpenStreetMap contributors.
Rightmove takes no liability for your use of, or reliance on, Rightmove's Instant Valuation due to the limitations of our tracking tool listed here. Use of this tool is taken entirely at your own risk. All rights reserved.