
House Prices in OX2
House prices in OX2 have an overall average of £741,716 over the last year.
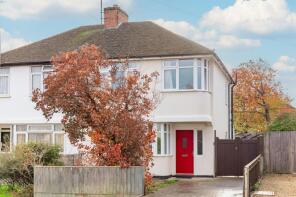
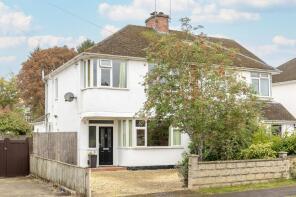
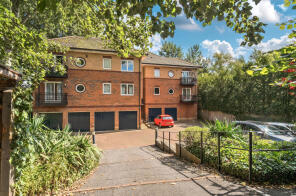
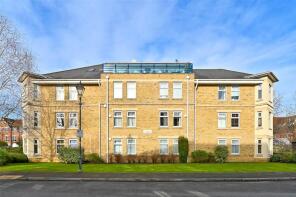
The majority of properties sold in OX2 during the last year were flats, selling for an average price of £401,422. Semi-detached properties sold for an average of £794,461, with detached properties fetching £1,143,930.
Overall, the historical sold prices in OX2 over the last year were 10% down on the previous year and 14% down on the 2023 peak of £861,349.
Properties Sold
44, Five Mile Drive, Oxford OX2 8HW
| Today | See what it's worth now |
| 22 Apr 2026 | £750,000 |
| 19 Jun 2017 | £692,500 |
No other historical records.
89, Frenchay Road, Oxford OX2 6TF

| Today | See what it's worth now |
| 15 Apr 2026 | £560,000 |
| 23 Feb 2001 | £212,500 |
No other historical records.
58, Foundry House Eagle Works, Walton Well Road, Oxford OX2 6AQ

| Today | See what it's worth now |
| 14 Apr 2026 | £620,000 |
| 1 Dec 2011 | £455,000 |
No other historical records.
Extensions and planning permission in OX2
See planning approval stats, extension build costs and value added estimates.

38, Merrivale Square, Oxford OX2 6QX
| Today | See what it's worth now |
| 8 Apr 2026 | £1,000,000 |
| 8 Mar 2002 | £375,000 |
102e, West Way, Oxford OX2 9JU
| Today | See what it's worth now |
| 2 Apr 2026 | £260,000 |
No other historical records.
98, Godstow Road, Wolvercote, Oxford OX2 8PF
| Today | See what it's worth now |
| 2 Apr 2026 | £340,000 |
| 5 May 2000 | £175,000 |
Flat 33, 153 Diamond Court, Banbury Road, Oxford OX2 7AA
| Today | See what it's worth now |
| 1 Apr 2026 | £165,000 |
| 31 Oct 2001 | £99,500 |
No other historical records.
24, Canal Street, Oxford OX2 6BH
| Today | See what it's worth now |
| 1 Apr 2026 | £660,000 |
| 9 Aug 2010 | £431,250 |
No other historical records.
76, Godstow Road, Oxford OX2 8NY

| Today | See what it's worth now |
| 31 Mar 2026 | £748,000 |
| 26 Jan 2024 | £400,000 |
No other historical records.
2, Ash Court, Lovelace Road, Oxford OX2 8LP
| Today | See what it's worth now |
| 31 Mar 2026 | £700,000 |
| 8 Aug 2023 | £735,000 |
25, Nursery Close, Oxford OX2 9GF
| Today | See what it's worth now |
| 27 Mar 2026 | £300,000 |
| 22 Aug 2018 | £290,000 |
37, Arthray Road, Oxford OX2 9AD
| Today | See what it's worth now |
| 27 Mar 2026 | £480,000 |
| 30 Jun 2003 | £172,000 |
No other historical records.
39, Arthray Road, Oxford OX2 9AD
| Today | See what it's worth now |
| 27 Mar 2026 | £543,000 |
| 20 Apr 2006 | £215,000 |
No other historical records.
Flat 4, Willowbrook, Water Eaton Road, Oxford OX2 7XD
| Today | See what it's worth now |
| 27 Mar 2026 | £360,000 |
| 26 Aug 2022 | £315,000 |
7, Alexandra Road, Oxford OX2 0DD
| Today | See what it's worth now |
| 27 Mar 2026 | £640,000 |
| 16 Aug 2024 | £575,000 |
13, Cox's Ground, Oxford OX2 6PX
| Today | See what it's worth now |
| 25 Mar 2026 | £863,000 |
| 26 Feb 2014 | £950,000 |
30, Bushy Close, Oxford OX2 9SH

| Today | See what it's worth now |
| 25 Mar 2026 | £320,000 |
| 9 Nov 2006 | £205,000 |
No other historical records.
105a, Bridge Street, Oxford OX2 0BD
| Today | See what it's worth now |
| 25 Mar 2026 | £490,000 |
| 29 Mar 1996 | £92,950 |
No other historical records.
1, Meadow Court, Ulfgar Road, Oxford OX2 8FH

| Today | See what it's worth now |
| 24 Mar 2026 | £576,000 |
No other historical records.
16, Stone Meadow, Oxford OX2 6TQ
| Today | See what it's worth now |
| 20 Mar 2026 | £930,000 |
| 31 Jan 2003 | £387,845 |
No other historical records.
15, Blandford Avenue, Oxford OX2 8EA
| Today | See what it's worth now |
| 20 Mar 2026 | £1,320,000 |
No other historical records.
6 Farmoor Rise, Cumnor Road, Farmoor, Oxford OX2 9NS
| Today | See what it's worth now |
| 19 Mar 2026 | £635,000 |
| 1 Oct 1999 | £190,000 |
No other historical records.
39, Park Close, Oxford OX2 8NP
| Today | See what it's worth now |
| 19 Mar 2026 | £365,000 |
| 11 Aug 2016 | £370,000 |
Source Acknowledgement: © Crown copyright. England and Wales house price data is publicly available information produced by the HM Land Registry.This material was last updated on 9 July 2026. It covers the period from 1 January 1995 to 30 April 2026 and contains property transactions which have been registered during that period. Contains HM Land Registry data © Crown copyright and database right 2026. This data is licensed under the Open Government Licence v3.0.
Disclaimer: Rightmove.co.uk provides this HM Land Registry data "as is". The burden for fitness of the data relies completely with the user and is provided for informational purposes only. No warranty, express or implied, is given relating to the accuracy of content of the HM Land Registry data and Rightmove does not accept any liability for error or omission. If you have found an error with the data or need further information please contact HM Land Registry.
Permitted Use: Viewers of this Information are granted permission to access this Crown copyright material and to download it onto electronic, magnetic, optical or similar storage media provided that such activities are for private research, study or in-house use only. Any other use of the material requires the formal written permission of Land Registry which can be requested from us, and is subject to an additional licence and associated charge.
Rightmove takes no liability for your use of, or reliance on, Rightmove's Instant Valuation due to the limitations of our tracking tool listed here. Use of this tool is taken entirely at your own risk. All rights reserved.