
House Prices in Ockley
House prices in Ockley have an overall average of £791,420 over the last year.
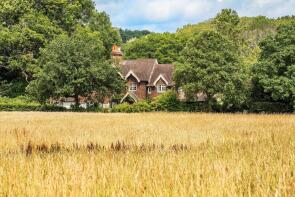
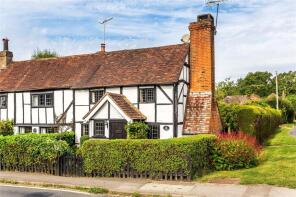
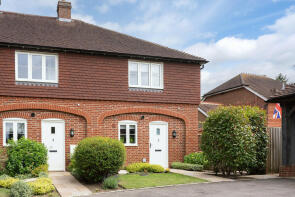
The majority of properties sold in Ockley during the last year were semi-detached properties, selling for an average price of £604,200. Detached properties sold for an average of £1,410,178, with terraced properties fetching £490,000.
Overall, the historical sold prices in Ockley over the last year were 31% down on the previous year and 31% down on the 2011 peak of £1,147,500.
Properties Sold
Broome Hall, Broomehall Road, Coldharbour RH5 6HJ


| Today | See what it's worth now |
| 28 Nov 2025 | £500,000 |
No other historical records.
Rosemary Cottage, Beare Green Road, Dorking RH5 4PY
| Today | See what it's worth now |
| 14 Nov 2025 | £925,000 |
| 16 Apr 2004 | £420,000 |
Ivy Cottage, Stane Street, Dorking RH5 5TH
| Today | See what it's worth now |
| 22 Aug 2025 | £540,000 |
| 21 May 2010 | £365,000 |
2, Kings Arms Court, Dorking RH5 5BD
| Today | See what it's worth now |
| 13 May 2025 | £515,000 |
| 12 Apr 2017 | £435,000 |
No other historical records.
4, Kings Arms Court, Dorking RH5 5BD
| Today | See what it's worth now |
| 24 Apr 2025 | £490,000 |
| 16 Jun 2017 | £425,000 |
No other historical records.
Tiphams, Weare Street, Ockley RH5 5NW
| Today | See what it's worth now |
| 31 Mar 2025 | £1,760,000 |
No other historical records.
The Rectory, Stane Street, Ockley RH5 5SY

| Today | See what it's worth now |
| 10 Mar 2025 | £1,060,356 |
No other historical records.
Leithlands Cottage, Stane Street, Dorking RH5 5TP
| Today | See what it's worth now |
| 7 Mar 2025 | £541,000 |
| 22 Jun 2016 | £480,000 |
No other historical records.
Flowerwood, Weare Street, Dorking RH5 5JA
| Today | See what it's worth now |
| 12 Feb 2025 | £1,075,000 |
| 29 Apr 2015 | £900,000 |
Weare Street Cottage, Weare Street, Ockley RH5 5NW
| Today | See what it's worth now |
| 10 Jan 2025 | £1,115,000 |
No other historical records.
Naylors, Stane Street, Dorking RH5 5TH
| Today | See what it's worth now |
| 8 Nov 2024 | £1,023,500 |
| 29 Sep 2006 | £480,000 |
No other historical records.
3, Leith Vale Cottages, Standon Lane, Dorking RH5 5QR
| Today | See what it's worth now |
| 27 Sep 2024 | £1,025,000 |
| 25 Oct 2002 | £330,000 |
Parklands, Mole Street, Ockley RH5 5PE

| Today | See what it's worth now |
| 9 Feb 2024 | £1,500,000 |
No other historical records.
3, Upper Oakdale Cottages, Weare Street, Ockley RH5 5NN

| Today | See what it's worth now |
| 19 Jan 2024 | £770,000 |
No other historical records.
7, Rectory Close, Dorking RH5 5TN

| Today | See what it's worth now |
| 30 Aug 2023 | £555,000 |
| 19 Mar 2004 | £272,500 |
No other historical records.
23, Cricketers Close, Dorking RH5 5BA

| Today | See what it's worth now |
| 23 Aug 2023 | £310,000 |
| 5 Oct 2016 | £275,000 |
Vann Croft (demol), Friday Street, Dorking RH5 5TE

| Today | See what it's worth now |
| 28 Apr 2023 | £2,000,000 |
| 1 Jul 2019 | £1,495,000 |
1, Ditches Green Cottages, Trap Lane, Dorking RH5 5QX

| Today | See what it's worth now |
| 19 Apr 2023 | £915,000 |
| 27 Sep 2006 | £546,000 |
Maple Cottage, Weare Street, Dorking RH5 5NW
| Today | See what it's worth now |
| 31 Mar 2023 | £588,999 |
No other historical records.
1, Fern Cottages, Stane Street, Dorking RH5 5TH

| Today | See what it's worth now |
| 21 Nov 2022 | £330,000 |
| 17 Aug 1999 | £151,000 |
Poundgate, Stane Street, Dorking RH5 5LU
| Today | See what it's worth now |
| 28 Oct 2022 | £1,625,110 |
No other historical records.
Pinehaven, Weare Street, Dorking RH5 5JA
| Today | See what it's worth now |
| 7 Oct 2022 | £1,555,000 |
| 25 Jul 2014 | £930,000 |
2, The Old School House, Stane Street, Ockley RH5 5TH
| Today | See what it's worth now |
| 5 Oct 2022 | £870,000 |
| 14 Jan 2000 | £415,000 |
No other historical records.
Cleavers, Woodland Drive, Dorking RH5 5HZ

| Today | See what it's worth now |
| 30 Sep 2022 | £1,100,000 |
No other historical records.
Middle Lodge, Standon, Stane Street, Dorking RH5 5LX
| Today | See what it's worth now |
| 16 Sep 2022 | £1,150,000 |
| 28 Jul 2000 | £475,100 |
No other historical records.
Source Acknowledgement: © Crown copyright. England and Wales house price data is publicly available information produced by the HM Land Registry.This material was last updated on 4 February 2026. It covers the period from 1 January 1995 to 24 December 2025 and contains property transactions which have been registered during that period. Contains HM Land Registry data © Crown copyright and database right 2026. This data is licensed under the Open Government Licence v3.0.
Disclaimer: Rightmove.co.uk provides this HM Land Registry data "as is". The burden for fitness of the data relies completely with the user and is provided for informational purposes only. No warranty, express or implied, is given relating to the accuracy of content of the HM Land Registry data and Rightmove does not accept any liability for error or omission. If you have found an error with the data or need further information please contact HM Land Registry.
Permitted Use: Viewers of this Information are granted permission to access this Crown copyright material and to download it onto electronic, magnetic, optical or similar storage media provided that such activities are for private research, study or in-house use only. Any other use of the material requires the formal written permission of Land Registry which can be requested from us, and is subject to an additional licence and associated charge.
Map data ©OpenStreetMap contributors.
Rightmove takes no liability for your use of, or reliance on, Rightmove's Instant Valuation due to the limitations of our tracking tool listed here. Use of this tool is taken entirely at your own risk. All rights reserved.