
House Prices in Old Dalby
House prices in Old Dalby have an overall average of £357,000 over the last year.
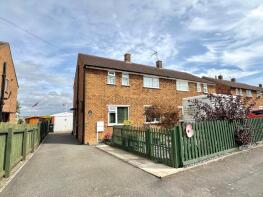
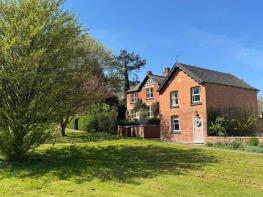
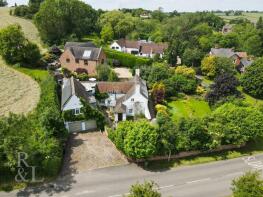
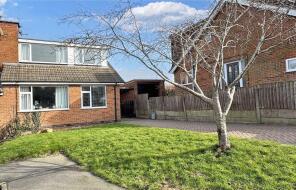
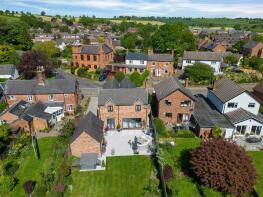
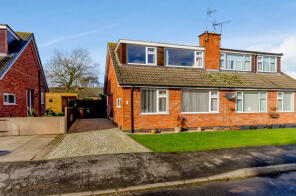
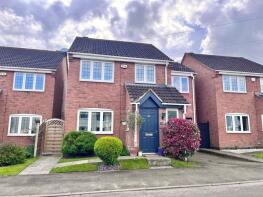
The majority of properties sold in Old Dalby during the last year were detached properties, selling for an average price of £453,750. Semi-detached properties sold for an average of £260,250.
Overall, the historical sold prices in Old Dalby over the last year were 12% down on the previous year and 19% down on the 2021 peak of £441,659.
Properties Sold
56, Queensway, Old Dalby LE14 3QH
| Today | See what it's worth now |
| 12 Dec 2025 | £240,000 |
No other historical records.
18 Resthaven, The Green, Melton Mowbray LE14 3LL
| Today | See what it's worth now |
| 9 Oct 2025 | £299,000 |
| 28 Sep 2022 | £215,000 |
28, The Green, Melton Mowbray LE14 3LL
| Today | See what it's worth now |
| 31 Jul 2025 | £580,000 |
| 23 Jul 2010 | £450,000 |
No other historical records.
24, Croft Gardens, Melton Mowbray LE14 3LE
| Today | See what it's worth now |
| 11 Jul 2025 | £232,000 |
| 12 Mar 2021 | £202,000 |
1, Meadow Vale Court, Old Dalby LE14 3EE


| Today | See what it's worth now |
| 15 May 2025 | £350,000 |
No other historical records.
16, Croft Gardens, Melton Mowbray LE14 3LE

| Today | See what it's worth now |
| 9 May 2025 | £270,000 |
| 8 Nov 2002 | £58,000 |
No other historical records.
12, Kingsway Close, Melton Mowbray LE14 3NG
| Today | See what it's worth now |
| 20 Mar 2025 | £315,000 |
| 28 Oct 2022 | £268,000 |
No other historical records.
16, North Lodge Road, Melton Mowbray LE14 3JT
| Today | See what it's worth now |
| 14 Mar 2025 | £570,000 |
| 16 Dec 2021 | £515,000 |
No other historical records.
8, Meadow Vale Court, Old Dalby LE14 3EE

| Today | See what it's worth now |
| 14 Feb 2025 | £870,000 |
No other historical records.
12, Main Road, Old Dalby LE14 3LT
| Today | See what it's worth now |
| 31 Jan 2025 | £280,000 |
| 21 Feb 2014 | £145,000 |
No other historical records.
7, Hedgerow Close, Old Dalby LE14 3JS

| Today | See what it's worth now |
| 19 Dec 2024 | £325,000 |
No other historical records.
7a, Church Lane, Old Dalby LE14 3LB

| Today | See what it's worth now |
| 19 Dec 2024 | £750,000 |
No other historical records.
13, Station Lane, Melton Mowbray LE14 3ND
| Today | See what it's worth now |
| 22 Nov 2024 | £195,000 |
| 1 Nov 2010 | £124,950 |
20a, Main Road, Melton Mowbray LE14 3LR
| Today | See what it's worth now |
| 31 Oct 2024 | £590,000 |
| 12 Dec 2017 | £430,000 |
31b, Paradise Lane, Old Dalby LE14 3NH

| Today | See what it's worth now |
| 28 Oct 2024 | £1,200,000 |
No other historical records.
5, Croft Gardens, Melton Mowbray LE14 3LE
| Today | See what it's worth now |
| 25 Oct 2024 | £324,000 |
| 4 May 2018 | £199,950 |
18, Knights Road, Old Dalby LE14 3NF

| Today | See what it's worth now |
| 25 Oct 2024 | £181,500 |
No other historical records.
43, Queensway, Old Dalby LE14 3QQ
| Today | See what it's worth now |
| 10 Oct 2024 | £240,000 |
No other historical records.
1b, Dukes Road, Melton Mowbray LE14 3LG
| Today | See what it's worth now |
| 30 Sep 2024 | £305,000 |
| 11 Dec 2015 | £164,000 |
2, Earls Road, Melton Mowbray LE14 3LQ
| Today | See what it's worth now |
| 27 Sep 2024 | £225,000 |
| 15 May 2015 | £150,000 |
9, Hedgerow Close, Old Dalby LE14 3JS

| Today | See what it's worth now |
| 18 Sep 2024 | £329,950 |
No other historical records.
2, Meadow Vale Court, Old Dalby LE14 3EE

| Today | See what it's worth now |
| 13 Sep 2024 | £430,000 |
No other historical records.
5, Hedgerow Close, Old Dalby LE14 3JS

| Today | See what it's worth now |
| 12 Sep 2024 | £320,000 |
No other historical records.
5, Meadow Vale Court, Old Dalby LE14 3EE

| Today | See what it's worth now |
| 6 Sep 2024 | £580,000 |
No other historical records.
4, Meadow Vale Court, Old Dalby LE14 3EE

| Today | See what it's worth now |
| 30 Aug 2024 | £435,000 |
No other historical records.
Source Acknowledgement: © Crown copyright. England and Wales house price data is publicly available information produced by the HM Land Registry.This material was last updated on 4 February 2026. It covers the period from 1 January 1995 to 24 December 2025 and contains property transactions which have been registered during that period. Contains HM Land Registry data © Crown copyright and database right 2026. This data is licensed under the Open Government Licence v3.0.
Disclaimer: Rightmove.co.uk provides this HM Land Registry data "as is". The burden for fitness of the data relies completely with the user and is provided for informational purposes only. No warranty, express or implied, is given relating to the accuracy of content of the HM Land Registry data and Rightmove does not accept any liability for error or omission. If you have found an error with the data or need further information please contact HM Land Registry.
Permitted Use: Viewers of this Information are granted permission to access this Crown copyright material and to download it onto electronic, magnetic, optical or similar storage media provided that such activities are for private research, study or in-house use only. Any other use of the material requires the formal written permission of Land Registry which can be requested from us, and is subject to an additional licence and associated charge.
Map data ©OpenStreetMap contributors.
Rightmove takes no liability for your use of, or reliance on, Rightmove's Instant Valuation due to the limitations of our tracking tool listed here. Use of this tool is taken entirely at your own risk. All rights reserved.