
House Prices in Peening Quarter
House prices in Peening Quarter have an overall average of £518,728 over the last year.
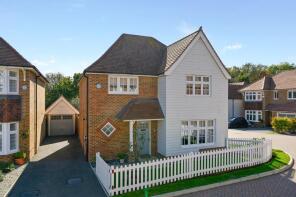
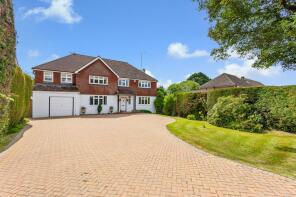
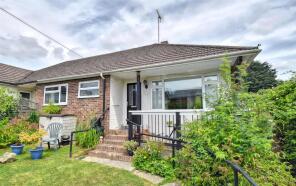
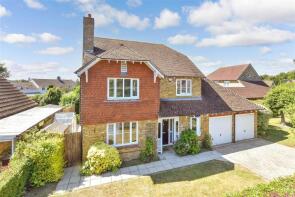
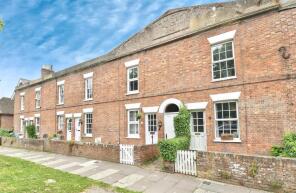
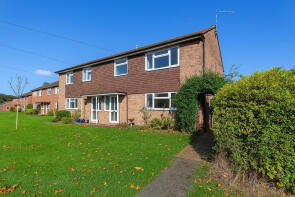
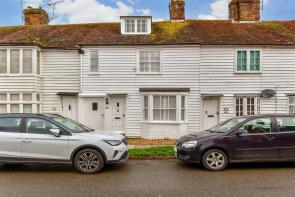
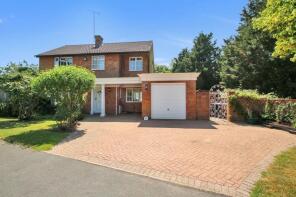
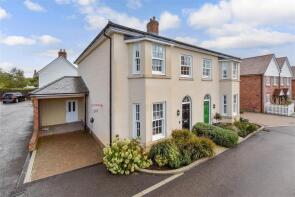
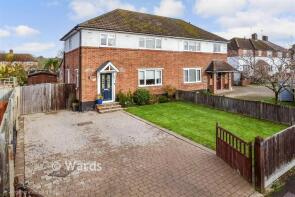
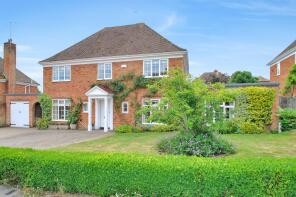
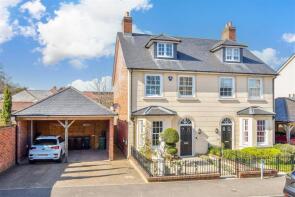
The majority of properties sold in Peening Quarter during the last year were detached properties, selling for an average price of £727,121. Semi-detached properties sold for an average of £414,776, with terraced properties fetching £352,042.
Overall, the historical sold prices in Peening Quarter over the last year were similar to the previous year and 5% down on the 2023 peak of £544,115.
Properties Sold
24, Bramley Grove, Tenterden TN30 7FB
| Today | See what it's worth now |
| 22 Apr 2026 | £627,500 |
| 26 Aug 2022 | £589,995 |
No other historical records.
11, Eastwell Meadows, Tenterden TN30 6QR

| Today | See what it's worth now |
| 9 Apr 2026 | £330,000 |
| 8 Apr 2011 | £247,500 |
No other historical records.
Orchard Cottage, Catts Hill, Stone TN30 7JR
| Today | See what it's worth now |
| 31 Mar 2026 | £280,000 |
No other historical records.
Owley Oast, Acton Lane, Wittersham TN30 7HL

| Today | See what it's worth now |
| 31 Mar 2026 | £2,850,000 |
No other historical records.
1, New Owley Cottages, Acton Lane, Wittersham TN30 7HL
| Today | See what it's worth now |
| 31 Mar 2026 | £300,000 |
No other historical records.
Heronden House, Woodchurch Road, Tenterden TN30 7AE
| Today | See what it's worth now |
| 26 Mar 2026 | £1,050,000 |
| 31 Mar 2017 | £850,000 |
Enidor, Beacon Oak Road, Tenterden TN30 6RY
| Today | See what it's worth now |
| 24 Mar 2026 | £363,000 |
| 8 Oct 2007 | £233,000 |
No other historical records.
31, William Judge Close, Tenterden TN30 7DS
| Today | See what it's worth now |
| 24 Mar 2026 | £500,000 |
| 12 Jul 2006 | £317,500 |
18, Oaks Road, Tenterden TN30 6RD
| Today | See what it's worth now |
| 23 Mar 2026 | £378,000 |
| 16 Sep 2022 | £295,000 |
No other historical records.
36, Forge Meads, Tenterden TN30 7PE
| Today | See what it's worth now |
| 19 Mar 2026 | £312,500 |
| 21 Feb 2019 | £240,000 |
13, Golden Square, Tenterden TN30 6RR
| Today | See what it's worth now |
| 13 Mar 2026 | £325,000 |
| 24 Nov 2003 | £209,000 |
2, Southgate Road, Tenterden TN30 7BS
| Today | See what it's worth now |
| 11 Mar 2026 | £549,000 |
| 14 Jan 2020 | £450,000 |
9, Holdstock Road, Tenterden TN30 7DU
| Today | See what it's worth now |
| 10 Mar 2026 | £590,000 |
| 25 Sep 2020 | £412,775 |
No other historical records.
17, Shrubcote, Tenterden TN30 7BP
| Today | See what it's worth now |
| 6 Mar 2026 | £375,000 |
| 19 Oct 2015 | £195,000 |
3, Eastgate Road, Tenterden TN30 7AH
| Today | See what it's worth now |
| 4 Mar 2026 | £795,000 |
| 30 Apr 2010 | £530,000 |
No other historical records.
39a, Golden Square, Tenterden TN30 6RN

| Today | See what it's worth now |
| 27 Feb 2026 | £165,000 |
| 7 Nov 2013 | £141,000 |
1, Bramley Grove, Tenterden TN30 7FB
| Today | See what it's worth now |
| 20 Feb 2026 | £650,000 |
| 15 Jul 2022 | £649,995 |
No other historical records.
5, Three Fields Road, Tenterden TN30 7AQ
| Today | See what it's worth now |
| 20 Feb 2026 | £575,000 |
| 15 Nov 2019 | £450,000 |
No other historical records.
14, Holdstock Road, Tenterden TN30 7DU
| Today | See what it's worth now |
| 16 Feb 2026 | £69,000 |
| 15 Nov 2024 | £69,000 |
5, The Cobs, Woodbury Lane, Tenterden TN30 6JH
| Today | See what it's worth now |
| 10 Feb 2026 | £365,000 |
| 29 Jun 2017 | £299,950 |
35, William Judge Close, Tenterden TN30 7DS

| Today | See what it's worth now |
| 10 Feb 2026 | £520,000 |
| 17 Dec 2013 | £320,000 |
Pippins, Cherry Orchard, Tenterden TN30 7LP
| Today | See what it's worth now |
| 23 Jan 2026 | £610,000 |
| 19 Aug 2016 | £460,000 |
11, Smallhythe Road, Tenterden TN30 7LH
| Today | See what it's worth now |
| 15 Jan 2026 | £255,000 |
No other historical records.
Source Acknowledgement: © Crown copyright. England and Wales house price data is publicly available information produced by the HM Land Registry.This material was last updated on 9 July 2026. It covers the period from 1 January 1995 to 30 April 2026 and contains property transactions which have been registered during that period. Contains HM Land Registry data © Crown copyright and database right 2026. This data is licensed under the Open Government Licence v3.0.
Disclaimer: Rightmove.co.uk provides this HM Land Registry data "as is". The burden for fitness of the data relies completely with the user and is provided for informational purposes only. No warranty, express or implied, is given relating to the accuracy of content of the HM Land Registry data and Rightmove does not accept any liability for error or omission. If you have found an error with the data or need further information please contact HM Land Registry.
Permitted Use: Viewers of this Information are granted permission to access this Crown copyright material and to download it onto electronic, magnetic, optical or similar storage media provided that such activities are for private research, study or in-house use only. Any other use of the material requires the formal written permission of Land Registry which can be requested from us, and is subject to an additional licence and associated charge.
Rightmove takes no liability for your use of, or reliance on, Rightmove's Instant Valuation due to the limitations of our tracking tool listed here. Use of this tool is taken entirely at your own risk. All rights reserved.