
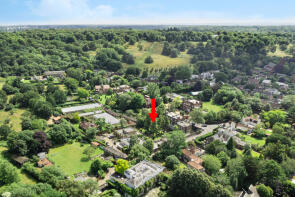
House Prices in Petersham
House prices in Petersham have an overall average of £1,434,231 over the last year.
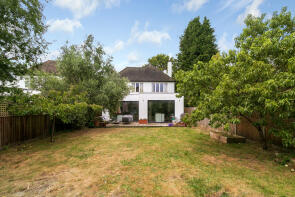
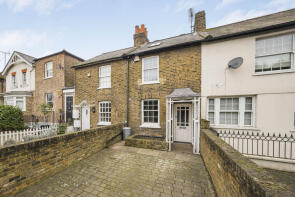
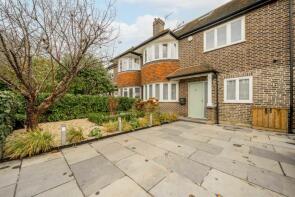
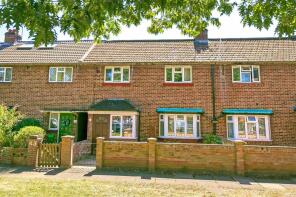
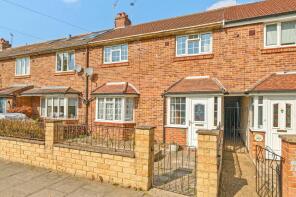
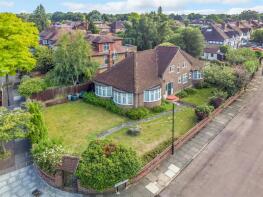
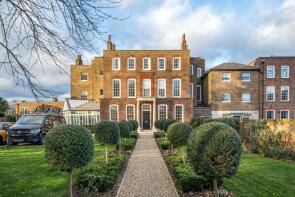
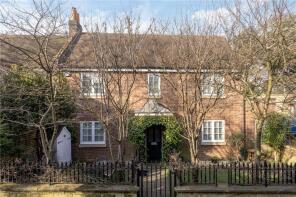
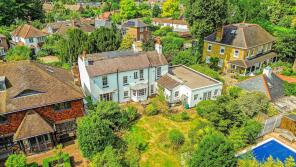
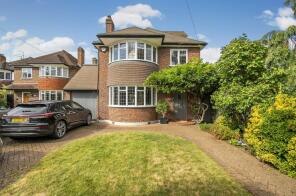
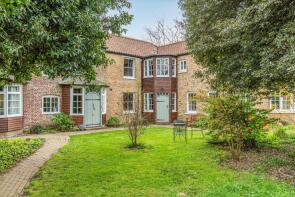
The majority of properties sold in Petersham during the last year were terraced properties, selling for an average price of £866,500. Detached properties sold for an average of £2,181,875, with semi-detached properties fetching £1,668,333.
Overall, the historical sold prices in Petersham over the last year were 13% down on the previous year and 38% down on the 2022 peak of £2,304,545.
Properties Sold
12, Bishops Close, Richmond TW10 7DF
| Today | See what it's worth now |
| 17 Oct 2025 | £580,000 |
| 12 Oct 2018 | £520,000 |
21, Sandpits Road, Richmond TW10 7DU
| Today | See what it's worth now |
| 29 Aug 2025 | £832,500 |
| 19 Aug 2015 | £825,000 |
4, Meadow Close, Richmond TW10 7AJ
| Today | See what it's worth now |
| 23 May 2025 | £1,400,000 |
| 16 Sep 1996 | £168,500 |
No other historical records.
51, Buckingham Road, Richmond TW10 7EH
| Today | See what it's worth now |
| 23 May 2025 | £1,175,000 |
| 21 Feb 2017 | £680,000 |
5, Sandy Lane, Richmond TW10 7EW
| Today | See what it's worth now |
| 23 May 2025 | £2,000,000 |
| 15 Oct 2004 | £815,000 |
No other historical records.
321, Petersham Road, Richmond TW10 7DB
| Today | See what it's worth now |
| 22 May 2025 | £860,000 |
| 26 May 2006 | £315,000 |
18, Ashley Gardens, Richmond TW10 7BU
| Today | See what it's worth now |
| 16 May 2025 | £1,900,000 |
| 8 Jan 2013 | £1,000,000 |
No other historical records.
8, Ashfield Close, Richmond TW10 7AF


| Today | See what it's worth now |
| 14 May 2025 | £2,950,000 |
| 2 Aug 2002 | £740,000 |
No other historical records.
45, Buckingham Road, Petersham TW10 7EH
| Today | See what it's worth now |
| 28 Mar 2025 | £760,000 |
No other historical records.
Rutland Cottage, River Lane, Richmond TW10 7AG
| Today | See what it's worth now |
| 28 Mar 2025 | £2,250,000 |
| 29 Mar 2018 | £1,525,000 |
No other historical records.
76, Buckingham Road, Petersham TW10 7EQ
| Today | See what it's worth now |
| 28 Mar 2025 | £705,000 |
No other historical records.
8, Lauderdale Drive, Petersham TW10 7BT
| Today | See what it's worth now |
| 21 Mar 2025 | £1,527,501 |
No other historical records.
5, Arlington Road, Richmond TW10 7BZ
| Today | See what it's worth now |
| 5 Mar 2025 | £1,705,000 |
| 11 Jun 2004 | £670,000 |
No other historical records.
8, 53 Orford Court, Ham Common, Richmond TW10 7JG
| Today | See what it's worth now |
| 28 Feb 2025 | £1,224,700 |
| 31 Mar 2021 | £1,150,000 |
No other historical records.
1, Forge Lane, Richmond TW10 7BF
| Today | See what it's worth now |
| 14 Feb 2025 | £1,360,000 |
| 27 Aug 2010 | £849,950 |
Woodbine Cottage, Petersham Road, Petersham TW10 7AL
| Today | See what it's worth now |
| 24 Jan 2025 | £2,345,000 |
No other historical records.
2, Lauderdale Drive, Richmond TW10 7BT
| Today | See what it's worth now |
| 24 Jan 2025 | £2,700,000 |
| 30 Apr 1999 | £330,000 |
No other historical records.
39, Lauderdale Drive, Petersham TW10 7BS
| Today | See what it's worth now |
| 23 Jan 2025 | £1,790,000 |
No other historical records.
4, Lauderdale Drive, Petersham TW10 7BT
| Today | See what it's worth now |
| 6 Jan 2025 | £1,700,000 |
No other historical records.
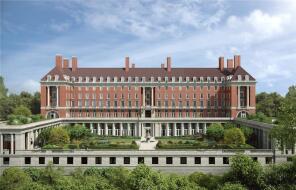
Flat 2, Star And Garter House, Richmond Hill, Richmond TW10 6BF

| Today | See what it's worth now |
| 13 Nov 2024 | £550,000 |
| 31 Mar 2017 | £650,000 |
No other historical records.
Flat 34, Star And Garter House, Richmond Hill, Richmond TW10 6BF

| Today | See what it's worth now |
| 25 Oct 2024 | £635,000 |
| 11 Oct 2017 | £820,000 |
82, Buckingham Road, Richmond TW10 7EQ
| Today | See what it's worth now |
| 26 Sep 2024 | £868,000 |
| 29 Jun 2021 | £725,000 |
No other historical records.
247, Petersham Road, Richmond TW10 7DA
| Today | See what it's worth now |
| 13 Sep 2024 | £2,450,000 |
| 10 Sep 2013 | £1,500,000 |
No other historical records.
The Navigators House, River Lane, Richmond TW10 7AG
| Today | See what it's worth now |
| 4 Sep 2024 | £4,500,000 |
| 6 Dec 2012 | £2,950,000 |
No other historical records.
Flat 76, Star And Garter House, Richmond Hill, Richmond TW10 6BF
| Today | See what it's worth now |
| 5 Aug 2024 | £2,600,000 |
| 1 Nov 2019 | £2,000,000 |
No other historical records.
Source Acknowledgement: © Crown copyright. England and Wales house price data is publicly available information produced by the HM Land Registry.This material was last updated on 4 February 2026. It covers the period from 1 January 1995 to 24 December 2025 and contains property transactions which have been registered during that period. Contains HM Land Registry data © Crown copyright and database right 2026. This data is licensed under the Open Government Licence v3.0.
Disclaimer: Rightmove.co.uk provides this HM Land Registry data "as is". The burden for fitness of the data relies completely with the user and is provided for informational purposes only. No warranty, express or implied, is given relating to the accuracy of content of the HM Land Registry data and Rightmove does not accept any liability for error or omission. If you have found an error with the data or need further information please contact HM Land Registry.
Permitted Use: Viewers of this Information are granted permission to access this Crown copyright material and to download it onto electronic, magnetic, optical or similar storage media provided that such activities are for private research, study or in-house use only. Any other use of the material requires the formal written permission of Land Registry which can be requested from us, and is subject to an additional licence and associated charge.
Map data ©OpenStreetMap contributors.
Rightmove takes no liability for your use of, or reliance on, Rightmove's Instant Valuation due to the limitations of our tracking tool listed here. Use of this tool is taken entirely at your own risk. All rights reserved.