
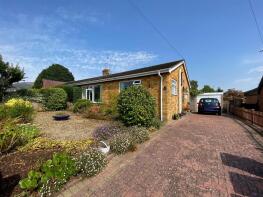
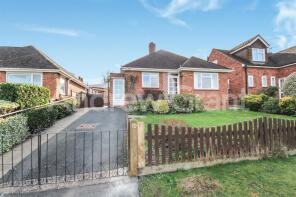
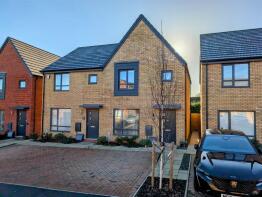
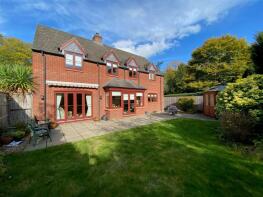
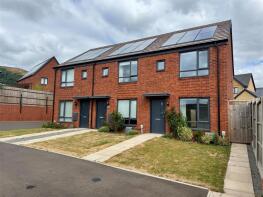
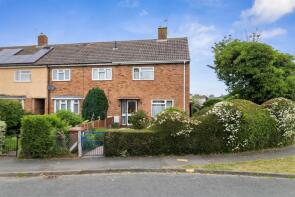
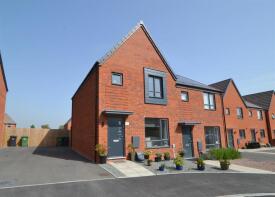
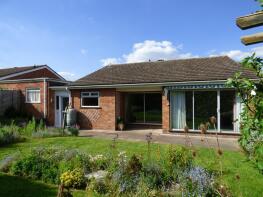
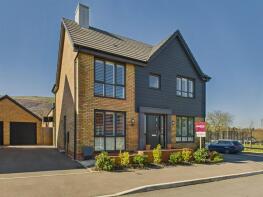
House Prices in Poolbrook
House prices in Poolbrook have an overall average of £326,209 over the last year.
The majority of properties sold in Poolbrook during the last year were semi-detached properties, selling for an average price of £281,812. Detached properties sold for an average of £483,308, with terraced properties fetching £223,667.
Overall, the historical sold prices in Poolbrook over the last year were 1% up on the previous year and 1% down on the 2023 peak of £330,119.
Properties Sold
102, Barnards Green Road, Malvern WR14 3ND
| Today | See what it's worth now |
| 20 Mar 2026 | £110,000 |
| 1 Oct 2004 | £115,000 |
No other historical records.
1, Strothers Avenue, Malvern WR14 3RS
| Today | See what it's worth now |
| 6 Feb 2026 | £250,000 |
No other historical records.
3, Strothers Avenue, Malvern WR14 3RS
| Today | See what it's worth now |
| 30 Jan 2026 | £250,000 |
| 29 Apr 2022 | £235,000 |
No other historical records.
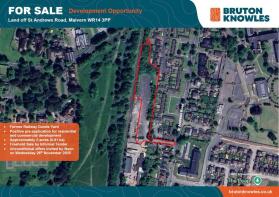
24, St Andrews Road, Malvern WR14 3PW
| Today | See what it's worth now |
| 29 Jan 2026 | £225,000 |
No other historical records.
23, St Bernard Drive, Malvern WR14 3PZ
| Today | See what it's worth now |
| 19 Dec 2025 | £315,000 |
| 28 Sep 2018 | £259,950 |
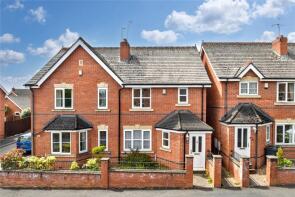
31, Bredon Grove, Malvern WR14 3JR
| Today | See what it's worth now |
| 26 Nov 2025 | £280,000 |
| 24 Jan 2014 | £180,000 |
10, Bredon Grove, Malvern WR14 3JR
| Today | See what it's worth now |
| 25 Nov 2025 | £252,781 |
| 10 Oct 2008 | £202,000 |
No other historical records.
26, Strothers Avenue, Malvern WR14 3RS
| Today | See what it's worth now |
| 21 Nov 2025 | £275,000 |
| 31 Oct 2022 | £287,000 |
No other historical records.
Epping Lodge, Hastings Pool, Malvern WR14 3QL
| Today | See what it's worth now |
| 17 Nov 2025 | £730,000 |
| 31 Mar 2008 | £525,000 |
No other historical records.
38, Strothers Avenue, Malvern WR14 3RS
| Today | See what it's worth now |
| 24 Oct 2025 | £246,000 |
| 20 Dec 2022 | £250,000 |
No other historical records.
11, Watkins Way, Malvern WR14 3NR
| Today | See what it's worth now |
| 17 Oct 2025 | £200,000 |
No other historical records.
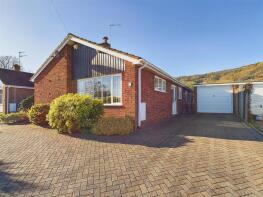
20, Bruneval Crescent, Malvern WR14 3RD
| Today | See what it's worth now |
| 15 Oct 2025 | £295,000 |
| 30 Jun 2022 | £275,000 |
No other historical records.
49, Britten Drive, Malvern WR14 3LG

| Today | See what it's worth now |
| 13 Oct 2025 | £320,000 |
| 28 Jun 2018 | £235,000 |
8, Fraser Close, Malvern WR14 3QG
| Today | See what it's worth now |
| 3 Oct 2025 | £315,000 |
No other historical records.
52, Geraldine Road, Malvern WR14 3PB
| Today | See what it's worth now |
| 26 Sep 2025 | £290,000 |
| 6 Oct 2010 | £214,000 |
No other historical records.
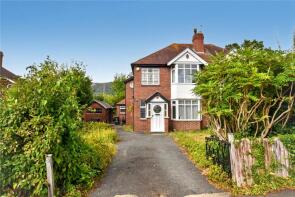
56, St Andrews Road, Malvern WR14 3PP
| Today | See what it's worth now |
| 16 Sep 2025 | £575,000 |
| 19 Sep 2017 | £429,000 |
8, St Bernard Drive, Malvern WR14 3PY
| Today | See what it's worth now |
| 10 Sep 2025 | £375,000 |
| 20 Dec 2002 | £226,000 |
40, Clarence Road, Malvern WR14 3EQ
| Today | See what it's worth now |
| 8 Sep 2025 | £310,000 |
| 16 Jun 2014 | £216,710 |
9, Werstan Close, Malvern WR14 3NH
| Today | See what it's worth now |
| 29 Aug 2025 | £521,000 |
No other historical records.
31, Cameron Court, St Andrews Road, Malvern WR14 3QQ

| Today | See what it's worth now |
| 29 Aug 2025 | £146,500 |
| 17 Feb 2006 | £112,000 |
No other historical records.
66, Geraldine Road, Malvern WR14 3PB
| Today | See what it's worth now |
| 26 Aug 2025 | £205,500 |
No other historical records.
59, St Andrews Road, Malvern WR14 3PT

| Today | See what it's worth now |
| 22 Aug 2025 | £690,000 |
No other historical records.
18, Watkins Way, Malvern WR14 3NS
| Today | See what it's worth now |
| 20 Aug 2025 | £200,000 |
No other historical records.
Source Acknowledgement: © Crown copyright. England and Wales house price data is publicly available information produced by the HM Land Registry.This material was last updated on 15 May 2026. It covers the period from 1 January 1995 to 31 March 2026 and contains property transactions which have been registered during that period. Contains HM Land Registry data © Crown copyright and database right 2026. This data is licensed under the Open Government Licence v3.0.
Disclaimer: Rightmove.co.uk provides this HM Land Registry data "as is". The burden for fitness of the data relies completely with the user and is provided for informational purposes only. No warranty, express or implied, is given relating to the accuracy of content of the HM Land Registry data and Rightmove does not accept any liability for error or omission. If you have found an error with the data or need further information please contact HM Land Registry.
Permitted Use: Viewers of this Information are granted permission to access this Crown copyright material and to download it onto electronic, magnetic, optical or similar storage media provided that such activities are for private research, study or in-house use only. Any other use of the material requires the formal written permission of Land Registry which can be requested from us, and is subject to an additional licence and associated charge.
Rightmove takes no liability for your use of, or reliance on, Rightmove's Instant Valuation due to the limitations of our tracking tool listed here. Use of this tool is taken entirely at your own risk. All rights reserved.