
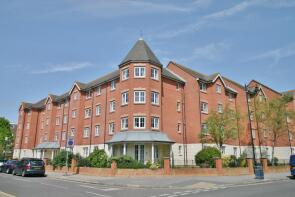
House Prices in Portsmouth
House prices in Portsmouth have an overall average of £298,282 over the last year.
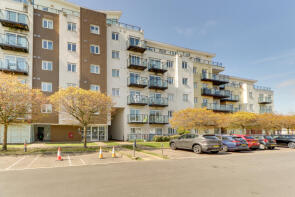
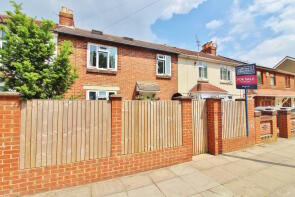
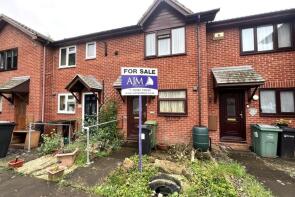
The majority of properties sold in Portsmouth during the last year were terraced properties, selling for an average price of £312,692. Flats sold for an average of £184,688, with semi-detached properties fetching £367,899.
Overall, the historical sold prices in Portsmouth over the last year were 2% up on the previous year and 5% up on the 2022 peak of £284,161.
Properties Sold
25, Mousehole Road, Portsmouth PO6 4JL
| Today | See what it's worth now |
| 27 Apr 2026 | £330,000 |
| 30 Jun 2017 | £200,000 |
No other historical records.
2, St Josephs Mews, Grove Road North, Southsea PO5 1HS
| Today | See what it's worth now |
| 27 Apr 2026 | £210,000 |
| 2 May 2014 | £125,000 |
51, Alverstone Road, Southsea PO4 8RP
| Today | See what it's worth now |
| 27 Apr 2026 | £260,000 |
| 29 Sep 2025 | £265,000 |
12, Ward Road, Southsea PO4 9PA
| Today | See what it's worth now |
| 24 Apr 2026 | £247,500 |
| 9 Aug 2019 | £208,250 |
16, Methuen Road, Southsea PO4 9HH
| Today | See what it's worth now |
| 24 Apr 2026 | £245,000 |
| 30 Aug 2013 | £150,000 |
6, Foxley Drive, Portsmouth PO3 5TG
| Today | See what it's worth now |
| 24 Apr 2026 | £325,000 |
| 1 Sep 2017 | £259,000 |
38, Wimborne Road, Southsea PO4 8DE
| Today | See what it's worth now |
| 24 Apr 2026 | £440,000 |
| 27 Dec 2009 | £202,000 |
No other historical records.
178, St Augustine Road, Southsea PO4 9AE
| Today | See what it's worth now |
| 24 Apr 2026 | £269,000 |
| 26 Aug 2022 | £286,630 |
21, Brampton Lane, Portsmouth PO3 5TB
| Today | See what it's worth now |
| 24 Apr 2026 | £245,056 |
| 12 Dec 2014 | £175,000 |
21, Ringwood Road, Southsea PO4 9JJ

| Today | See what it's worth now |
| 24 Apr 2026 | £247,500 |
| 15 Dec 2020 | £240,000 |
28, Inhurst Road, Portsmouth PO2 0QL
| Today | See what it's worth now |
| 22 Apr 2026 | £325,000 |
| 13 Dec 2000 | £97,000 |
No other historical records.
75, George Street, Portsmouth PO1 5RA
| Today | See what it's worth now |
| 20 Apr 2026 | £260,000 |
| 8 Mar 2019 | £217,500 |
8, 58 Hazel Court, Goldsmith Avenue, Southsea PO4 8QU
| Today | See what it's worth now |
| 20 Apr 2026 | £212,000 |
| 15 Mar 2024 | £212,000 |
16, Gurnard Road, Portsmouth PO6 3HN
| Today | See what it's worth now |
| 17 Apr 2026 | £265,000 |
| 2 Nov 2001 | £83,500 |
No other historical records.
11, Highbury Grove, Portsmouth PO6 2RJ
| Today | See what it's worth now |
| 17 Apr 2026 | £365,000 |
| 10 Jun 2011 | £202,000 |
No other historical records.
14, Union Road, Portsmouth PO3 6GF
| Today | See what it's worth now |
| 17 Apr 2026 | £370,000 |
| 29 Jul 2014 | £226,995 |
No other historical records.
29, Whitecliffe Avenue, Portsmouth PO3 6HZ
| Today | See what it's worth now |
| 17 Apr 2026 | £248,000 |
| 25 Sep 2020 | £240,000 |
64, Holmbush Court, Queens Crescent, Southsea PO5 3HZ
| Today | See what it's worth now |
| 17 Apr 2026 | £135,000 |
| 5 Dec 2016 | £149,950 |
6, 89 Burlington Lodge, Victoria Road South, Southsea PO5 2BU

| Today | See what it's worth now |
| 17 Apr 2026 | £229,000 |
| 18 Jul 2023 | £235,000 |
122, Knox Road, Portsmouth PO2 8JL

| Today | See what it's worth now |
| 17 Apr 2026 | £195,000 |
| 8 Aug 2001 | £72,000 |
6, Carnarvon Road, Portsmouth PO2 7NL

| Today | See what it's worth now |
| 17 Apr 2026 | £214,000 |
| 16 Dec 2020 | £192,000 |
27, Firgrove Crescent, Portsmouth PO3 5LT

| Today | See what it's worth now |
| 17 Apr 2026 | £690,000 |
| 5 Nov 2012 | £325,000 |
29, Admirals House, Gisors Road, Southsea PO4 8GX
| Today | See what it's worth now |
| 17 Apr 2026 | £200,000 |
| 4 Nov 2013 | £149,500 |
Source Acknowledgement: © Crown copyright. England and Wales house price data is publicly available information produced by the HM Land Registry.This material was last updated on 9 July 2026. It covers the period from 1 January 1995 to 30 April 2026 and contains property transactions which have been registered during that period. Contains HM Land Registry data © Crown copyright and database right 2026. This data is licensed under the Open Government Licence v3.0.
Disclaimer: Rightmove.co.uk provides this HM Land Registry data "as is". The burden for fitness of the data relies completely with the user and is provided for informational purposes only. No warranty, express or implied, is given relating to the accuracy of content of the HM Land Registry data and Rightmove does not accept any liability for error or omission. If you have found an error with the data or need further information please contact HM Land Registry.
Permitted Use: Viewers of this Information are granted permission to access this Crown copyright material and to download it onto electronic, magnetic, optical or similar storage media provided that such activities are for private research, study or in-house use only. Any other use of the material requires the formal written permission of Land Registry which can be requested from us, and is subject to an additional licence and associated charge.
Rightmove takes no liability for your use of, or reliance on, Rightmove's Instant Valuation due to the limitations of our tracking tool listed here. Use of this tool is taken entirely at your own risk. All rights reserved.