
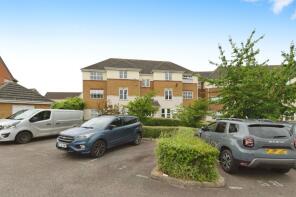
House Prices in RM16
House prices in RM16 have an overall average of £416,599 over the last year.
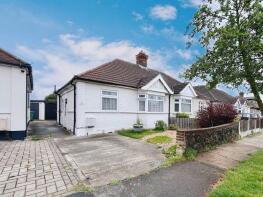
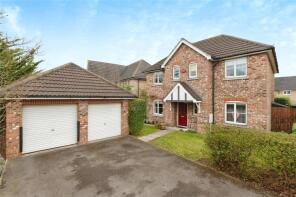
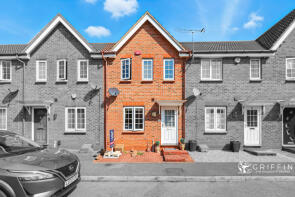
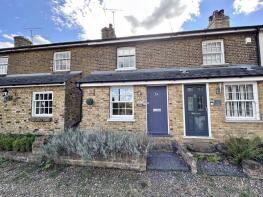
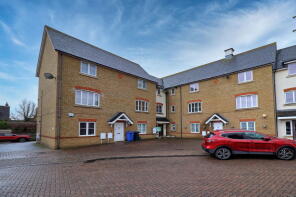
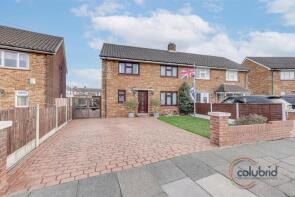
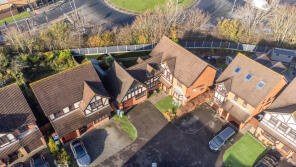
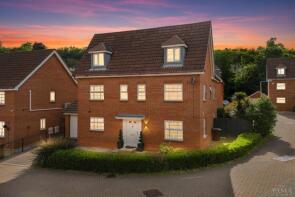
The majority of properties sold in RM16 during the last year were semi-detached properties, selling for an average price of £432,548. Terraced properties sold for an average of £371,420, with detached properties fetching £571,792.
Overall, the historical sold prices in RM16 over the last year were 4% up on the previous year and 4% up on the 2023 peak of £400,190.
Properties Sold
7, Conrad Close, Grays RM16 2TW
| Today | See what it's worth now |
| 20 Apr 2026 | £580,000 |
| 17 Nov 2022 | £565,000 |
4, Celedon Close, Chafford Hundred, Grays RM16 6PZ

| Today | See what it's worth now |
| 17 Apr 2026 | £314,000 |
| 22 Dec 2005 | £158,000 |
207, Godman Road, Grays RM16 4TR
| Today | See what it's worth now |
| 15 Apr 2026 | £270,000 |
| 20 Nov 2009 | £100,000 |
No other historical records.
Extensions and planning permission in RM16
See planning approval stats, extension build costs and value added estimates.

33, Connaught Avenue, Grays RM16 2XR
| Today | See what it's worth now |
| 14 Apr 2026 | £450,000 |
| 7 Jun 2004 | £110,000 |
No other historical records.
11, King Edward Drive, Grays RM16 2GG
| Today | See what it's worth now |
| 9 Apr 2026 | £790,000 |
| 5 Nov 2010 | £275,000 |
No other historical records.
38, Crowstone Road, Grays RM16 2SR
| Today | See what it's worth now |
| 7 Apr 2026 | £350,000 |
| 31 Aug 2005 | £178,000 |
No other historical records.
75, Drake Road, Chafford Hundred, Grays RM16 6RG
| Today | See what it's worth now |
| 2 Apr 2026 | £597,500 |
| 19 Dec 2002 | £284,995 |
No other historical records.
46, Frobisher Gardens, Chafford Hundred, Grays RM16 6EJ
| Today | See what it's worth now |
| 2 Apr 2026 | £350,000 |
| 27 Jan 2006 | £178,000 |
No other historical records.
Emilys Cottage, Fordhams Row, Orsett RM16 3LA
| Today | See what it's worth now |
| 1 Apr 2026 | £280,000 |
No other historical records.
10, Merlin Close, Chafford Hundred, Grays RM16 6RY
| Today | See what it's worth now |
| 31 Mar 2026 | £210,000 |
| 27 Jun 2000 | £89,995 |
No other historical records.
30, Welling Road, Grays RM16 3DF
| Today | See what it's worth now |
| 30 Mar 2026 | £325,000 |
| 28 Sep 2021 | £300,000 |
232, Long Lane, Stifford Clays, Grays RM16 2QB

| Today | See what it's worth now |
| 27 Mar 2026 | £449,995 |
| 1 Jun 2017 | £277,000 |
No other historical records.
42, Stour Road, Grays RM16 4BU

| Today | See what it's worth now |
| 27 Mar 2026 | £375,000 |
| 24 May 2002 | £120,000 |
No other historical records.
25, Fairway, Stifford Clays, Grays RM16 2AJ
| Today | See what it's worth now |
| 27 Mar 2026 | £380,000 |
No other historical records.
29, Camden Close, Grays RM16 4HT
| Today | See what it's worth now |
| 27 Mar 2026 | £310,000 |
| 7 Dec 2001 | £62,000 |
No other historical records.
70, Welling Road, Grays RM16 3DW
| Today | See what it's worth now |
| 25 Mar 2026 | £312,500 |
| 4 Jun 2021 | £281,000 |
63, Dudley Close, Chafford Hundred, Grays RM16 6PG
| Today | See what it's worth now |
| 25 Mar 2026 | £176,500 |
| 18 Jul 2003 | £110,000 |
59, Heath View Road, Grays RM16 2RS
| Today | See what it's worth now |
| 16 Mar 2026 | £449,000 |
| 17 Aug 2018 | £385,000 |
67, Godman Road, Chadwell St Mary RM16 4TD
| Today | See what it's worth now |
| 16 Mar 2026 | £350,000 |
No other historical records.
14, Cardinal Road, Chafford Hundred, Grays RM16 6DW
| Today | See what it's worth now |
| 13 Mar 2026 | £475,000 |
| 30 Oct 2009 | £240,000 |
15, San Marcos Drive, Chafford Hundred, Grays RM16 6LW
| Today | See what it's worth now |
| 13 Mar 2026 | £214,000 |
| 1 Apr 2022 | £220,000 |
34, Waterson Road, Grays RM16 4NT
| Today | See what it's worth now |
| 12 Mar 2026 | £430,000 |
| 24 Jul 1998 | £51,000 |
No other historical records.
60, Gilbert Road, Chafford Hundred, Grays RM16 6NR
| Today | See what it's worth now |
| 11 Mar 2026 | £770,000 |
| 14 Jun 1996 | £135,000 |
No other historical records.

Source Acknowledgement: © Crown copyright. England and Wales house price data is publicly available information produced by the HM Land Registry.This material was last updated on 9 July 2026. It covers the period from 1 January 1995 to 30 April 2026 and contains property transactions which have been registered during that period. Contains HM Land Registry data © Crown copyright and database right 2026. This data is licensed under the Open Government Licence v3.0.
Disclaimer: Rightmove.co.uk provides this HM Land Registry data "as is". The burden for fitness of the data relies completely with the user and is provided for informational purposes only. No warranty, express or implied, is given relating to the accuracy of content of the HM Land Registry data and Rightmove does not accept any liability for error or omission. If you have found an error with the data or need further information please contact HM Land Registry.
Permitted Use: Viewers of this Information are granted permission to access this Crown copyright material and to download it onto electronic, magnetic, optical or similar storage media provided that such activities are for private research, study or in-house use only. Any other use of the material requires the formal written permission of Land Registry which can be requested from us, and is subject to an additional licence and associated charge.
Rightmove takes no liability for your use of, or reliance on, Rightmove's Instant Valuation due to the limitations of our tracking tool listed here. Use of this tool is taken entirely at your own risk. All rights reserved.